Chapter: Mechanical : Total Quality Management (TQM) : TQM Tools & Techniques
Management Tool: Affinity Diagram
New Seven management Tools
It is a simple and effective tool. This approach focuses on the process (to reveal the causes), rather than the people.
Example: Why was there a delay in dispatch of good? Cutting tool failed, resulting in delay in manufacture. Why? The tools were reused?
Why? Ordered tool were not delivered?
Solution changes the dispatch schedule, if ever the tools were not delivered.
Forced Field Analysis
ReadersŌĆÖ attention is invited to the discussion in Chapter 2 on this topic.
Nominal Group Technique
This technique provides for ideas input from every one in the team and for effective decision making.
A team wants to decide upon a current complaint to attend. Every one in the team writes the problem on a paper, what they think is most important. They are listed in a chart and then the team members are asked to rank, from most important to least important. The ranking are given a numerical value starting from, say, on a 10 to 1 scale. Points for each problem is totaled and the ones with highest number of points, is considered o be the most important.
The seven advanced tools of quality management or the ŌĆśNew SevenŌĆÖ is a collection of tools put together by a set of Japanese quality professionals. , Arrow Diagram, was known to engineers and project managers by names like PERT (Programme Evaluation and Review Technique) or CMP (Critical Mean Path). Another tool in this set PDPC (Process Decision Programme Chart) has been used in operations research.
CONCEPT
These tools, unlike SPC tools are qualitative tools. Most of these tools do not involve the use of numerical data.
. Like all management tools these are judgmental tools.
Managers are often called upon to make decisions based on their judgement with help of incomplete information or on subjective issues.
Team work and techniques like brainstorming are very essential for best results with such tools.
The seven tools we will see are :
1. Affinity diagram
2. Relations diagram
3. Tree diagram
4. Matrix diagram
5. Matrix data analysis diagram .
6 .Process decision programme chart
7. Arrow diagram
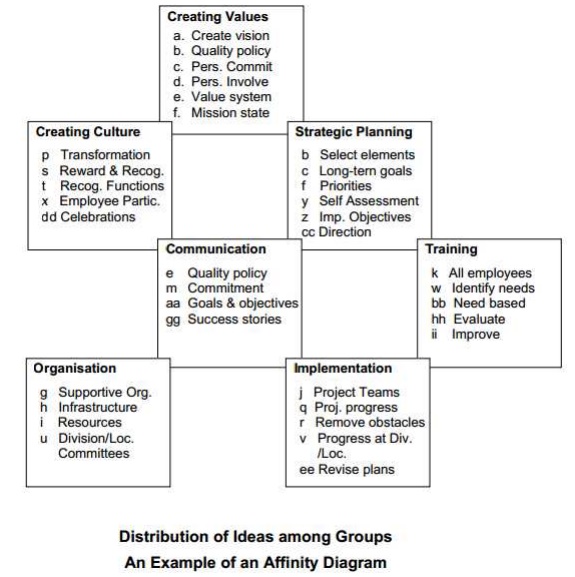
Affinity Diagram
The purpose of an affinity diagram is to provide a visual representation of grouping of a large number of ideas or factors or requirements into logical sets of related items to help one organise action plans in a systematic manner.
Procedure
The steps in the procedure for preparing an affinity diagram are :
1. Decide the subject or the topic
2. Generate a large number of ideas through brainstorming
3. Decide the number of groups and their titles. Create a card for each group. Enter the title of the group at the top of the card.
4. Distribute all the ideas among the cards. If necessary, create new cards for additional groups.
5. Arrange the cards according to the relationship between the groups.
6. Give a name to the affinity diagram.
Applications:
The structure and the procedure for affinity diagram would have shown how simple the tool is. Its simplicity makes it easy to combine it with other tools and put it to a wide variety of applications. For instance, it can be combined with a cause-and-effect diagram or a relations diagram to identify and regroup causes for a problem or it can be combined with a tree diagram to categorise
possible solutions. Thus it can assist in problem solving. It can be used to group customer requirements in a complex product and can help one to design a product with characteristics and features that would satisfy and delight customers. It can be used to categorise actions in an implementation plan leading to a rationalised distribution of responsibility. In fact the tool can
be used to break up any complex problem or task into smaller more easily manageable bits. Someone has asked a question - ŌĆ£How do you eat a whale ?ŌĆØ which has an obvious answer -ŌĆØA mouthful at a timeŌĆØ. Another similar set of a question and an answer is - ŌĆ£How to eat an elephant - slice by sliceŌĆØ.
Well affinity diagram is a tool that helps to break up a whale into convenient mouthfuls or an elephant into manageable slices. Its simplicity makes it a very widely applicable tool.
Related Topics