Chapter: Mechanical : Total Quality Management (TQM) : TQM Tools & Techniques
Management Tool: Arrow Diagram
New Seven management Tools
It is a simple and effective tool. This approach focuses on the process (to reveal the causes), rather than the people.
Example: Why was there a delay in dispatch of good? Cutting tool failed, resulting in delay in manufacture. Why? The tools were reused?
Why? Ordered tool were not delivered?
Solution changes the dispatch schedule, if ever the tools were not delivered.
Forced Field Analysis
ReadersŌĆÖ attention is invited to the discussion in Chapter 2 on this topic.
Nominal Group Technique
This technique provides for ideas input from every one in the team and for effective decision making.
A team wants to decide upon a current complaint to attend. Every one in the team writes the problem on a paper, what they think is most important. They are listed in a chart and then the team members are asked to rank, from most important to least important. The ranking are given a numerical value starting from, say, on a 10 to 1 scale. Points for each problem is totaled and the ones with highest number of points, is considered o be the most important.
The seven advanced tools of quality management or the ŌĆśNew SevenŌĆÖ is a collection of tools put together by a set of Japanese quality professionals. , Arrow Diagram, was known to engineers and project managers by names like PERT (Programme Evaluation and Review Technique) or CMP (Critical Mean Path). Another tool in this set PDPC (Process Decision Programme Chart) has been used in operations research.
CONCEPT
These tools, unlike SPC tools are qualitative tools. Most of these tools do not involve the use of numerical data.
. Like all management tools these are judgmental tools.
Managers are often called upon to make decisions based on their judgement with help of incomplete information or on subjective issues.
Team work and techniques like brainstorming are very essential for best results with such tools.
The seven tools we will see are :
1. Affinity diagram
2. Relations diagram
3. Tree diagram
4. Matrix diagram
5. Matrix data analysis diagram .
6 .Process decision programme chart
7. Arrow diagram
Arrow Diagram
Purpose
The purpose of an arrow diagram is to create a visual presentation of the steps of a process or tasks necessary to complete a project with special emphasis on the time taken for these activities. The diagram provides a clear understanding of the schedule of various steps in the process which helps one to monitor the process for ensuring its completion on time.
Procedure
The steps for preparing an arrow diagram are :
1. List all tasks or activities that need to be accomplished before the completion of the process or the project.
2. Decide which steps are undertaken in series and which steps can be run in parallel.
3. Arrange the activities in a proper sequence.
4. Prepare ŌĆśEvent NodesŌĆÖ at the completion of steps and number them. Where the process is
bifurcating into two or more parallel streams, more lines will flow from a node and where the parallel streams are merging, two or more steps will lead to a node.
5. Write the description of the step on top of the line or to the left of the line. Decide the time required for completing each step and write it under or to the right of the line.
6. Calculate the earliest time to reach an event node for the start of the process. Where more than one streams are combining, the maximum time taken by a stream is taken into consideration. This time is entered on the top half of the rectangle. This time is related to the starting time of the process which is taken as zero.
7. After the time for all event nodes including the completion of the process or the project is available, one calculates the latest time by which an event node must be reached. This is done by starting at the time of completion and going back step by step. The time is entered on the bottom half of the rectangle. The time indication at all event nodes will appear as :
X Y where X is the earliest time by which the event can be completed and Y is the latest time by which the event should be completed.
Give a title to the diagram. As the calculation of the time indications is extremely important in the construction of an arrow diagram it is necessary that we understand the procedure well. Let us understand the concept through diagram.
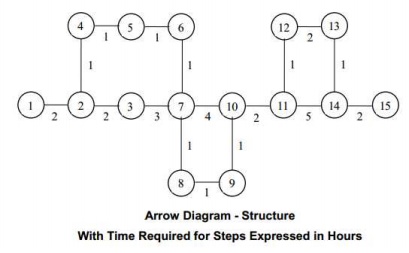
Let us calculate the time the events can be reached earliest by adding time for the step to the time of the earlier event starting with zero time at the start i.e. event-1. Where there are two streams one has to take the time for the longer or the critical path. The time to be put on the top half of the rectangle for the 15 event nodes are given in table 3.
For event node 7, we get two values. As the time for node 6 is 5 hours and step from 6 to 7 takes one hour, the time for 7 would be 6 hours. But time for node 3 is 4 hours and the step from 3 to 7 takes 3 hours, the time for node 7 comes to 7 hours. The earliest both streams get ready is 7 hours and hence one has to take 7 hours as the time for node 7. The same principle has been applied for calculating the time for nodes 10 and 14.
Now let us see how to calculate the time to be put on the bottom half of the rectangle or the time by which the event must be reached to ensure
1 2 3 7 10 11 14 15
8 9
1 1 2
1 1 1 1
2 2 3 4 2 5 2
1 11completion of the project on time. In this case one has to start with event 15 as 20 hours and calculate the time for the event by reducing the time taken for the step. Step from event 14 to 15 takes 2 hours. To complete the project at 20 hours, it is essential that one reaches event 14 by 18 hours. In this way
we get the time by which the events must be accomplished. These are given in table 4. Applications
The most common application of an arrow diagram is in planning and scheduling projects which involve a large number of activities. The diagram is also useful in planning and scheduling steps in complicated processes. Once an arrow diagram is ready with time indications for all stages of the project or the process, referred as the event nodes in the procedure, one can look for
opportunities to reduce the time taken for the project by concentrating on the steps on the critical path. It can then be used to monitor the progress of the project throughout its duration.
Related Topics