Chapter: Mechanical : Total Quality Management (TQM) : TQM Tools & Techniques
Matrix Data Analysis Diagram
New Seven management Tools
It is a simple and effective tool. This approach focuses on the process (to reveal the causes), rather than the people.
Example: Why was there a delay in dispatch of good? Cutting tool failed, resulting in delay in manufacture. Why? The tools were reused?
Why? Ordered tool were not delivered?
Solution changes the dispatch schedule, if ever the tools were not delivered.
Forced Field Analysis
ReadersŌĆÖ attention is invited to the discussion in Chapter 2 on this topic.
Nominal Group Technique
This technique provides for ideas input from every one in the team and for effective decision making.
A team wants to decide upon a current complaint to attend. Every one in the team writes the problem on a paper, what they think is most important. They are listed in a chart and then the team members are asked to rank, from most important to least important. The ranking are given a numerical value starting from, say, on a 10 to 1 scale. Points for each problem is totaled and the ones with highest number of points, is considered o be the most important.
The seven advanced tools of quality management or the ŌĆśNew SevenŌĆÖ is a collection of tools put together by a set of Japanese quality professionals. , Arrow Diagram, was known to engineers and project managers by names like PERT (Programme Evaluation and Review Technique) or CMP (Critical Mean Path). Another tool in this set PDPC (Process Decision Programme Chart) has been used in operations research.
CONCEPT
These tools, unlike SPC tools are qualitative tools. Most of these tools do not involve the use of numerical data.
. Like all management tools these are judgmental tools.
Managers are often called upon to make decisions based on their judgement with help of incomplete information or on subjective issues.
Team work and techniques like brainstorming are very essential for best results with such tools.
The seven tools we will see are :
1. Affinity diagram
2. Relations diagram
3. Tree diagram
4. Matrix diagram
5. Matrix data analysis diagram .
6 .Process decision programme chart
7. Arrow diagram
Matrix Data Analysis Diagram
Purpose
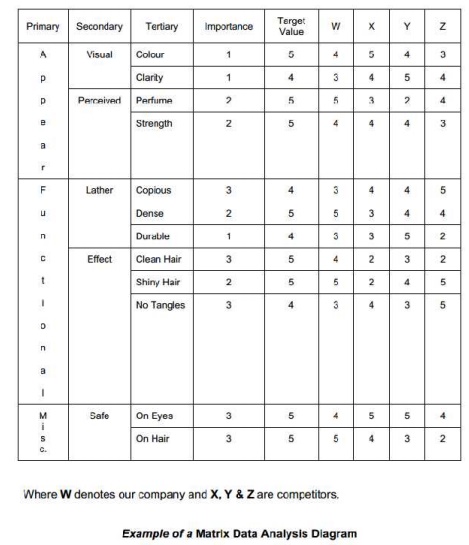
The purpose of matrix data analysis diagram is to present numerical data about two sets of factors in a matrix form and analyse it to get numerical output. The factors most often are products and product characteristics. The purpose then is to analyse the data on several characteristics for a number of products and use the information to arrive at optimum values for the characteristics for a new product or to decide the strong points of a product and use the information for designing a strategy for the promotion of the product.
Procedure
The procedure for creating a matrix data analysis diagram consists of the following steps:
1. Decide the two factors whose relations are to be analyses.
2. Check the number of individual items in the two factors.
3. Prepare a matrix to accommodate all the items of the two factors.
4. Enter numerical data in the matrix.
5. Give the diagram a suitable title. Applications
The most common application of matrix data analysis diagram is to decide the desired product characteristics of a new product based on the analysis of product characteristics of similar products in the market and the intended positioning of the new product. For instance the characteristics of a toilet soap for customers with normal skin would be somewhere in between those for a soap for dry skin and a soap for oily skin. A cosmetic product for growing children would have characteristics between those of a baby cosmetic and an adult cosmetic. By collecting data on the product characteristics of related products and placing them in a matrix data analysis diagram, one can decide the desired characteristics of the proposed product depending on target group of customers for the new product.
Analysis of the data can also be used to identify the strongest characteristics of an existing product to decide its promotional inputs. The tool can also be used to study the causes of customer complaints. It can also be used to determine process parameters to achieve desired product characteristics.
The tool can be very useful in compiling data obtained on the analysis of competitive products with a view to develop a product better than the competition or to devise a marketing strategy for the product based on its strengths.

Process Decision Programme Chart Purpose
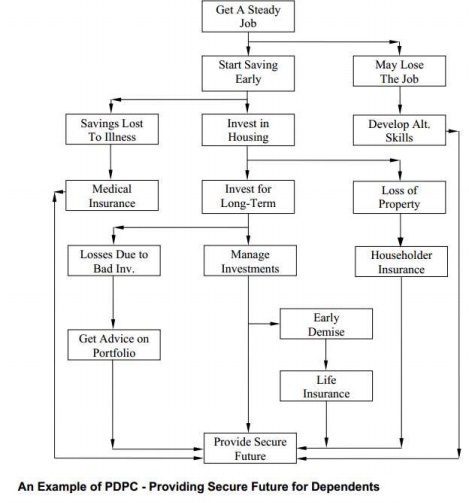
The purpose of process decision programme chart is to prepare for abnormal occurrences with low probability which may otherwise be overlooked and to present the occurrences as well as the necessary countermeasures to guard against such occurrences in the form of a visual chart. The tool forces one to
think of the possible obstacles in the smooth progress of a process or a project and then find ways and means to surmount those obstacles to ensure the successful and timely completion of the process or the project. Thus the tool helps one to prepare a contingency plan to achieve the objective if
adverse events occur.
Procedure
The steps in the preparation of a process decision programme chart are :
1. Prepare a ŌĆśnormalŌĆÖ flowchart of the process with all expected events as steps in the chart.
2. Consider the possibility of the process not going as per the plan due to any abnormal, though less probable, occurrences.
3. Show these occurrences on the flowchart through branching at appropriate locations.
4. Consider how the abnormal occurrence will affect the process and search for ways and means to counter the effect.
5. Show these countermeasures in rectangles connecting the corresponding abnormal occurrence on one side and the process objective or the goal on the other.
6. Give a suitable title to the diagram.
Steps 2 and 4 require totally different type of thinking and hence the team must be prepared to think on appropriate lines. One needs to put on different ŌĆśthinking hatsŌĆÖ while brainstorming steps 2 and 4
and the facilitator must inform all members about it. As suggested by Dr. Edward De Bono in his book ŌĆśSix Thinking HatsŌĆÖ the correct thinking hats for steps 2 and 4 are black and yellow which respectively encourage ŌĆśnegative logicalŌĆÖ and ŌĆśpositive logicalŌĆÖ thinking.
Applications
The tool has the widest range of applications as it can be used for a range of activities from simple ones like a game of bridge or reaching railway station or airport in time to catch a train or a plane to complex processes or projects. In fact if can be applied to all processes to ensure their success by systematically minimising the untoward effect of unexpected adverse occurrences. Through the process of brainstorming for possible adverse occurrences and for measures to counter them, one assures the success of the process even if such events do occur. The tool can be used to prevent problems by identifying opportunities for error and devising measures to avoid failure. It can be used during the implementation of solutions for predicting resistance and for planning measures to overcome the resistance.
Process decision programme chart

Related Topics