Chapter: Modern Analytical Chemistry: Gravimetric Methods of Analysis
Particulate Gravimetry: Theory and Practice
Theory and Practice
Two
approaches have been used to separate the analyte from its matrix in particu- late gravimetry. The most
common approach is filtration, in which solid
particu- lates are separated from their gas, liquid, or solid matrix.
A second approach
uses a liquid-phase or solid-phase extraction.
Filtration
Liquid samples
are filtered by pulling the liquid through
an appropriate filtering medium,
either by gravity
or by applying suction from
a vacuum pump
or aspirator. The choice
of filtering medium
is dictated primarily by the size of the solid particles and the sample’s matrix.
Filters are constructed from a variety
of ma- terials, including cellulose fibers, glass
fibers, cellulose nitrate,
and polytetrafluo- roethylene (PTFE).
Particle retention depends
on the size of the filter’s pores.
Cellu- lose fiber filters,
commonly referred to as filter
paper, range in pore size from 30 μm
to 2–3 μm. Glass fiber filters, constructed from chemically inert borosilicate glass, range in pore size
from 2.5 μm to 0.3
μm. Membrane filters, which are made
from a variety of materials,
including cellulose nitrate and PTFE, are available with pore sizes from 5.0 μm to 0.1 μm.
Solid aerosol particulates in gas samples
are filtered using
either a single
or multiple stage. In a single-stage system the gas is passed through a single filter,
re- taining particles larger
than the filter’s
pore size. When sampling a gas line,
the filter is placed directly in line. Atmospheric gases are sampled
with a high-volume sam- pler that uses a vacuum pump to pull air through
the filter at a rate of approxi- mately 75 m3/h. In either case,
the filtering medium
used for liquid
samples also can be
used for gas samples. In a multiple-stage system, a series
of filtering units
is used to separate
the particles by size.
Solid samples are
separated by particle size using one
or more sieves.
By select- ing several
sieves of different mesh size, particulates with a narrow
size range can be
isolated from the
solid matrix. Sieves
are available in a variety
of mesh sizes,
ranging from approximately 25 mm to 40 μm.
Extraction
Filtering limits
particulate gravimetry to solid particulate analytes that are easily
separated from their
matrix. Particulate gravimetry can be extended to the analysis of gas-phase analytes, solutes, and poorly
filterable solids if the analyte
can be extracted from its matrix
with a suitable solvent. After
extraction, the solvent
can be evaporated and the mass of the extracted analyte
determined. Alternatively, the analyte can be determined indirectly by measuring the change in a sample’s
mass after extracting the
analyte.
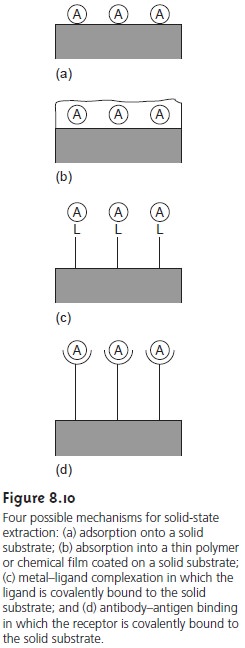
More recently, methods
for particulate gravimetry have been developed
in which the analyte
is separated by adsorption onto a metal
surface, by absorption into a thin polymer
or chemical film coated on a solid
support, or by chemically
binding to a suitable receptor
covalently bound to a solid support (Figure
8.10). Ad- sorption, absorption, and binding occur at the interface between
the metal surface, the thin film, or the receptor, and the solution containing the analyte.
Conse- quently, the amount of analyte extracted
is minuscule, and the resulting
change in mass is too small
to detect with a conventional balance. This problem
is overcome by using
a quartz crystal
microbalance as a support.

The
measurement of mass using a quartz crystal
microbalance is based on the piezoelectric effect.10 When a piezoelectric material, such as a quartz crystal, experi- ences a mechanical stress, it generates
an electrical potential
whose magnitude is proportional to the applied
stress. Conversely, when an alternating electrical field is applied across a quartz crystal, an oscillatory vibrational motion is induced
in the crystal. Every
quartz crystal vibrates
at a characteristic resonant frequency that is a function of the crystal’s properties, including the mass per unit area of any material
coated on the crystal’s surface. The change in mass following adsorption, absorption,
or binding of the analyte,
therefore, can be determined by monitoring the change in the quartz crystal’s characteristic
resonant frequency. The exact relationship between the change in frequency and mass is determined by a calibration curve.
Related Topics