Chapter: Modern Analytical Chemistry: Obtaining and Preparing Samples for Analysis
Liquid–Liquid Extractions
Liquid–Liquid
Extractions
A liquid–liquid extraction is one of the most important separation techniques used in environmental, clinical, and industrial laboratories. Two examples from envi-
ronmental analysis serve
to illustrate its
importance. Public drinking water supplies are routinely monitored for trihalomethanes (CHCl3, CHBrCl2, CHBr2Cl, and CHBr3) because
of their known or suspected
carcinogeneity. Before their analysis
by gas chromatography, trihalomethanes are separated from their aqueous
matrix by a liquid–liquid extraction using pentane.21 A liquid–liquid extraction is also used in screening orange
juice for the
presence of organophosphorous pesticides. A
sample of orange juice is mixed with acetonitrite and filtered. Any organophospho-
rous pesticides that
might be present
in the filtrate are extracted with
petroleum ether before a gas chromatographic analysis.22
In
a simple liquid–liquid extraction the solute
is partitioned between
two im- miscible phases.
In most cases
one of the phases is aqueous, and the other
phase is an organic
solvent such as diethyl ether
or chloroform. Because
the phases are im-
miscible, they form two layers,
with the denser
phase on the bottom. The solute is initially present in one phase, but after extraction it is present
in both phases. The efficiency of a liquid–liquid extraction is determined by the equilibrium constant for the solute’s
partitioning between the two phases.
Extraction efficiency is also in- fluenced by any secondary reactions involving the solute. Examples
of secondary re- actions include acid–base and
complexation equilibria.
Partition Coefficients and Distribution Ratios
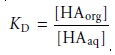
Earlier we learned that the partitioning of a solute between two phases is described
by a partition coefficient. If the solute
is initially in an aqueous
phase and is ex-
tracted into an organic phase*
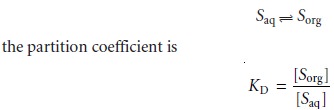
A large value
for KD indicates that
the extraction of the solute
into the organic
phase is favorable.
In
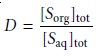
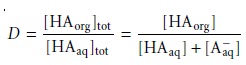
evaluating the efficiency of an extraction, however, we must consider the solute’s total concentration in each phase.
We define the distribution ratio, D, to
be the ratio of the
solute’s total concentration in each phase.
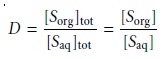
When the solute exists in only one form in each phase, then the partition
coefficient and the distribution ratio are identical. If, however, the solute exists
in more than one
form in either phase, then KD and D usually have different values.
For example, if the
solute exists in two forms
in the aqueous
phase, A and
B, only one
of which, A, partitions itself between the
two phases, then
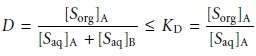
This distinction between
KD and D is important. The partition coefficient is an equilibrium constant
and has a fixed value
for the solute’s
partitioning between the two
phases. The value
of the distribution ratio, however,
changes with solution
con- ditions if the
relative amounts of forms A and B change. If we know
the equilibrium reactions taking place within each phase and between
the phases, we can derive an
algebraic relationship between
KD and D.
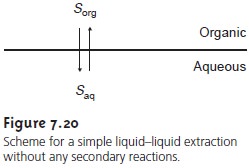
Liquid–Liquid Extraction with No Secondary Reactions
In the simplest form of
liquid–liquid extraction, the only reaction affecting extrac- tion efficiency, is the partitioning of the solute
between the two phases (Figure
7.20). In this case
the distribution ratio
and the partition coefficient are equal.
 7.19
7.19
Conservation of mass requires
that the moles
of solute initially present in one phase equal the combined
moles of solute
in the aqueous and organic
phases after the extraction; thus
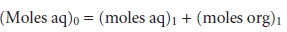 7.20
7.20
where the subscript indicates the extraction number. The concentration of S in the aqueous phase after the
extraction is
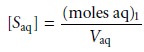 7.21
7.21
whereas the solute’s concentration in the organic
phase is
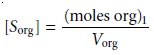 7.22
7.22
where Vaq and Vorg are the volumes
of the aqueous and organic
phases. Solving equation 7.20 for (moles
org)1 and substituting into equation 7.22 leave us with
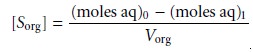 7.23
7.23
Substituting equations 7.21 and 7.23
into equation 7.19, we obtain

Rearranging and solving for the fraction
of solute remaining
in the aqueous phase after one extraction, (qaq)1, gives
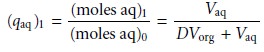 7.24
7.24
The fraction present in the organic
phase after one extraction, (qorg)1,
is
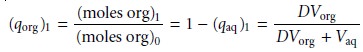
The fraction present in the organic
phase after one extraction, (qorg)1,
is
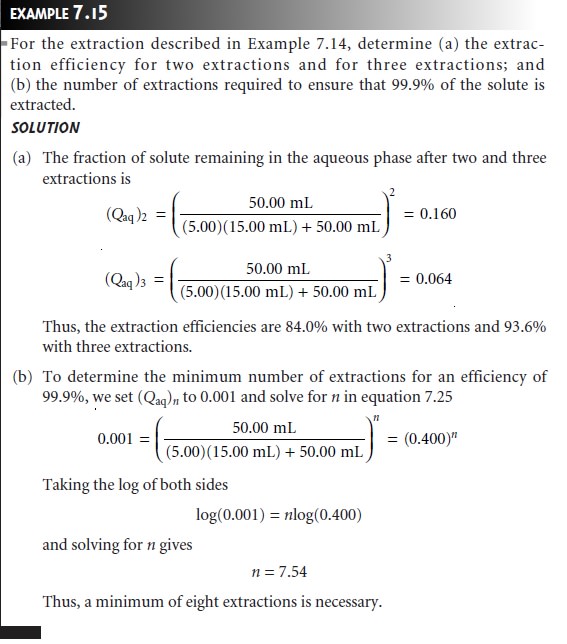
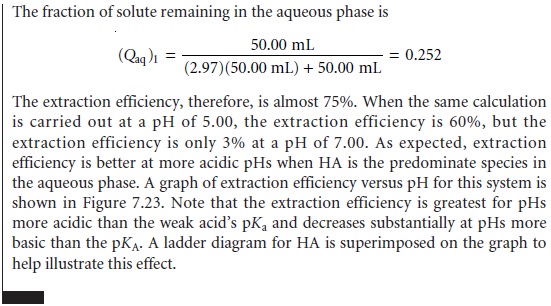
Example 7.14 shows how equation 7.24 is used to calculate the efficiency of a simple liquid–liquid extraction.
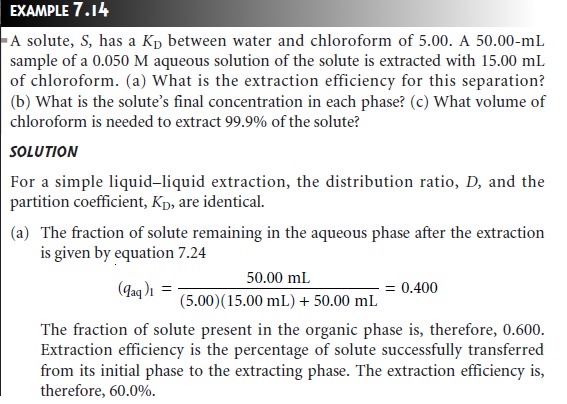
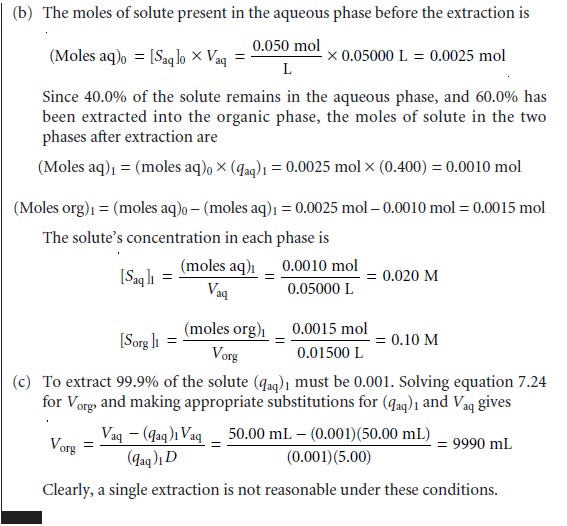
In
Example 7.14 a single extraction results in an extraction efficiency of only 60%. If a second
extraction is carried
out, the fraction
of solute remaining in the aqueous phase,
(qaq)2, is given by
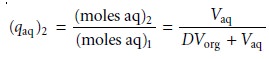
If
the volumes of the aqueous
and organic layers are the same for both extractions, then the cumulative fraction
of solute remaining
in the aqueous layer after two ex- tractions, (Qaq)2, is
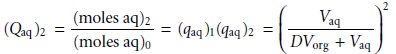
In
general, for a series of n identical extractions, the fraction of analyte remaining in the aqueous phase
after the last extraction is
 7.25
7.25
An important observation from Examples 7.14
and 7.15 is that an extraction
efficiency of 99.9%
can be obtained with less solvent
when using multiple extrac- tions. Obtaining this extraction efficiency with one extraction requires 9990 mL of
the organic solvent.
Eight extractions using
separate 15-mL portions
of the or- ganic solvent, however, requires only 120
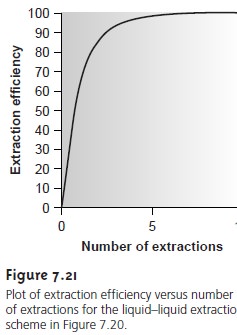
mL. Although extraction efficiency in-
creases dramatically with the first
few multiple extractions, the effect quickly
di- minishes as the number
of extractions is increased (Figure
7.21). In most cases
there is little gain in extraction efficiency after five or six extractions. In Example 7.15 five extractions are needed to reach an extraction efficiency of 99%, and
an additional three extractions are required to obtain the
extra 0.9% increase in ex- traction
efficiency.
Liquid–Liquid Extractions Involving Acid–Base Equilibria
In a simple
liquid–liquid extraction the distribution ratio
and the partition coeffi- cient are identical. As a result,
the distribution ratio
is unaffected by any change
in the composition of the aqueous
or organic phase.
If the solute
also partici- pates in a single-phase equilibrium reaction, then the
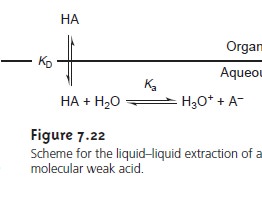
distribution ratio and the partition coefficient may not be the same. For example, Figure 7.22
shows the equilibria occurring when extracting an aqueous solution
contain- ing a molecular weak acid, HA,
with an organic
phase in which
ionic species are not soluble. In this case the partition
coefficient and the distribution ratio are
 7.26
7.26
 7.27
7.27
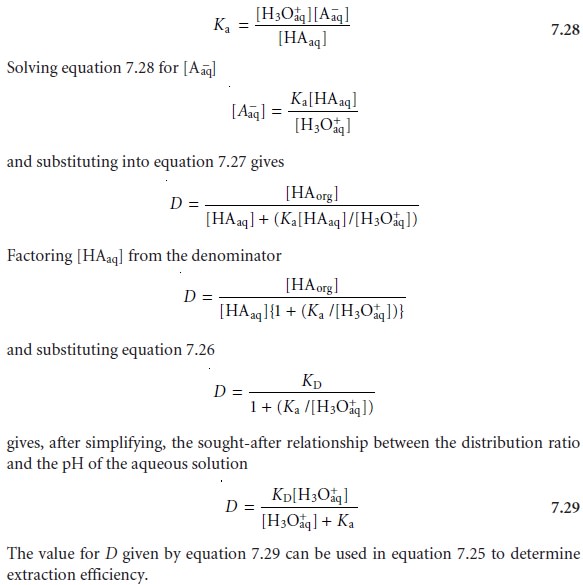
Since the position of an acid–base equilibrium depends on the pH, the distribution ratio must also be pH-dependent. To derive an equation for D showing this depen-
dency, we begin with the
acid dissociation constant for HA.
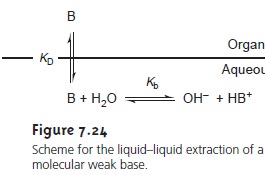
The same approach
can be used to derive an equation
for the distri- bution ratio when the solute is a molecular weak base, B, (Figure 7.24). The resulting distribution ratio
is
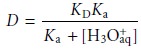
where Ka is the acid dissociation constant
for the weak base’s conjugate weak acid.
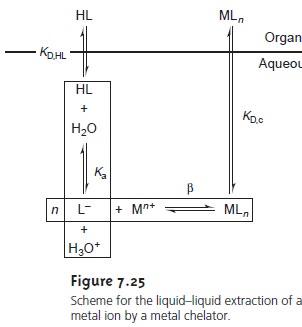
Liquid–Liquid Extractions Involving Metal Chelators
One
of the most common applications of a liquid–liquid extraction is the selective extraction of metal ions using a chelating agent. Unfor- tunately,
many chelating agents have a limited
solubility in water or are subject
to hydrolysis or air oxidation
in aqueous solutions.
For these reasons
the chelating agent is added to the organic solvent in- stead
of the aqueous phase. The
chelating agent is extracted
into the aqueous phase, where it reacts to form a stable metal–ligand complex with the metal ion. The metal–ligand complex is then extracted
into the organic phase. A summary
of the relevant equilibria is shown in Figure 7.25.
If
the ligand’s concentration is much greater
than the metal
ion’s concentration, the distribution ratio is given
as*
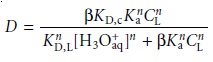 7.30
7.30
where CL is the initial
concentration of ligand
in the organic phase be- fore
the extraction. The distribution ratio
calculated using equation
7.30 can be substituted back into equation
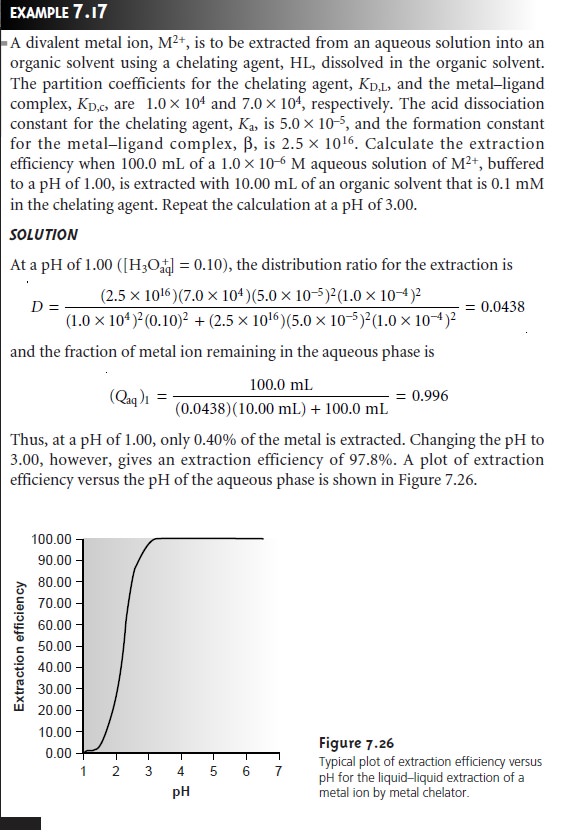
7.25 to determine the extraction efficiency. As shown in Example 7.17, the extraction efficiency for metal ions shows a marked
pH dependency.
One
of the advantages of using a chelating agent is the high degree of selec- tivity that it brings to the extraction
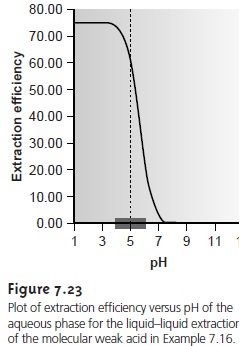
of metal ions. As shown in Example 7.17 and
Figure 7.26, the extraction
efficiency for a divalent cation increases from approximately 0%–100% over a range of only 2 pH units. Furthermore, a chelating
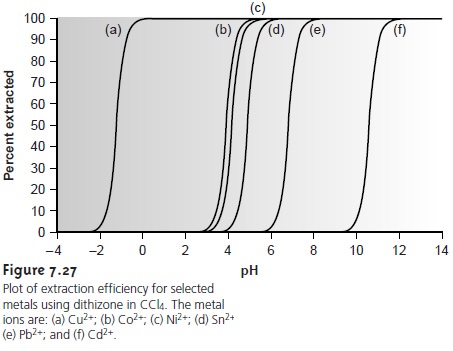
agent’s metal–ligand formation constant varies substantially between metal ions. As a result, significant differences arise in the pH range over which different metal ions experience an increase
in extraction efficiency
from 0% to 100%
(Figure 7.27).
Liquid–liquid extractions using ammonium
pyrrolidine dithiocarbamate (APDC) as a metal chelating agent are commonly encountered in the
analysis of metal ions in aqueous
samples. The sample
and APDC are mixed together, and the resulting metal–ligand complexes are extracted
into methyl isobutyl
ketone before analysis.
Related Topics