Tests of Significance - Basic Concepts and Large Sample Tests - Introduction | 12th Statistics : Chapter 1 : Tests of Significance - Basic Concepts and Large Sample Tests
Chapter: 12th Statistics : Chapter 1 : Tests of Significance - Basic Concepts and Large Sample Tests
Introduction
TEST OF SIGNIFICANCE- BASIC CONCEPTS AND LARGE SAMPLE TESTS
Jerzy Neyman (1894-1981) was born into a Polish family in Russia. He is
one of the Principal architects of Modern Statistics. He developed the idea of
confidence interval estimation during 1937. He had also contributed to other
branches

He established the Department of
Statistics in University of California at Berkeley, which is one of the preeminent
centres for statistical research worldwide.
Egon Sharpe Pearson (1885-1980) was the son was the son of Prof.
Karl Pearson. He was the Editor of Biometrika, which is still one of the
premier journals in Statistics. He was Pearson instrumental in publishing the
two volumes of Biometrika Tables for Statisticians, which has been a
significant contribution to the world of Statistical Data Analysis till the
invention of modern computing facilities.

Neyman and Pearson worked together about a decade from 1928 to
1938 and developed the theory of testing statistical hypotheses. Neyman-Pearson
Fundamental Lemma is a milestone work, which forms the basis for the
present theory of testing statistical hypotheses. In spite of severe criticisms
for their theory, in those days, by the leading authorities especially
Prof.R.A.Fisher, their theory survived and is currently in use.
“Statistics is the servant to all sciences” – Jerzy Neyman

LEARNING OBJECTIVES
The students will be able to
·
understand the purpose of hypothesis testing;
·
define parameter and statistic;
·
understand sampling distribution of statistic;
·
define standard error;
·
understand different types of hypotheses;
·
determine type I and type II errors in hypotheses testing
problems;
·
understand level of significance, critical region and critical
values;
·
categorize one-sided and two-sided tests;
·
understand the procedure for tests of hypotheses based on large
samples; and
·
solve the problems of testing hypotheses concerning mean(s) and
proportion(s) based on large samples.
Introduction
In XI Standard classes, we concentrated on collection,
presentation and analysis of data along with calculation of various measures of
central tendency and measures of dispersion. These kinds of describing the data
are popularly known as descriptive statistics. Now, we need to understand another dimension
of statistical data analysis, which is called inferential statistics. Various concepts and
methods related to this dimension will be discussed in the first four Chapters
of this volume. Inferential Statistics may be described as follows from the
statistical point of view:
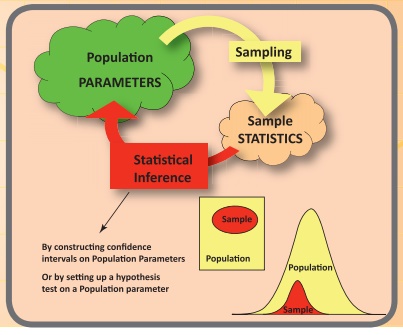
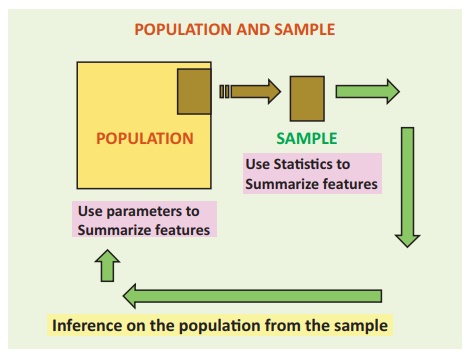
One of the main objectives of any scientific investigation or any
survey is to find out the unknown facts or characteristics of the population
under consideration. It is practically not feasible to examine the entire
population, since it will increase the time and cost involved. But one may
examine a part of it, called sample. On the basis of this limited information, one
can make decisions or draw inferences on the unknown facts or characteristics
of the population.

Thus, inferential statistics refers to a collection of statistical
methods in which random samples are used to draw valid inferences or to make
decisions in terms of probabilistic statements about the population under
study.
Before going to study in detail about Inferential Statistics, we need to understand some of the important terms and definitions related to this topic.
Related Topics