Procedure Steps, Example Solved Problems | Statistics - Test of Hypotheses for Equality of Means of two Populations (Population Variances are Known) | 12th Statistics : Chapter 1 : Tests of Significance - Basic Concepts and Large Sample Tests
Chapter: 12th Statistics : Chapter 1 : Tests of Significance - Basic Concepts and Large Sample Tests
Test of Hypotheses for Equality of Means of two Populations (Population Variances are Known)
TEST OF HYPOTHESES FOR EQUALITY OF MEANS OF TWO POPULATIONS (Population
variances are known)
Procedure:
Step-1 : Let µX and σX2 be
respectively the mean and the variance of Population -1. Also, let µY
and σY2 be respectively the mean and
the variance of Population -2 under study. Here σX2
and σY2 are known admissible values.
Frame the null hypothesis as H0: µX =
µY and choose the suitable alternative hypothesis from
H1: µX ≠ µY (ii) H1: µX>
µY (iii) H1: µX< µY
Step-2 :
Let (X1, X2, …, Xm)
be a random sample of m observations drawn from Population-1 and (Y1,
Y2, …, Yn) be a random sample of n
observations drawn from Population-2, where m and n are large(i.e.,
m ≥ 30 and n ≥ 30). Further, these two samples are assumed to be independent.
Step-3 : Specify the level of significance, α.
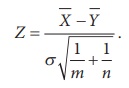
Step-4 : Consider the test statistic 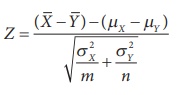 under H0, where
 ![]() and
and ![]() are respectively the means of the two samples described in Step-2.
are respectively the means of the two samples described in Step-2.
The approximate sampling
distribution of the test statistic Z =  under H0
(i.e., µX = µY) is the N(0,1) distribution.
under H0
(i.e., µX = µY) is the N(0,1) distribution.
It may be noted that the
test statistic, when 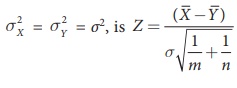 .
.
Step-5 : Calculate the value of Z for the given samples (x1, x2, x3,…. xm) and (y1, y 2, y 3,…. ym) as 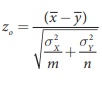 .
.
Here, ![]() and
and ![]() are respectively the values of
are respectively the values of ![]() and
and ![]() for the given samples.
for the given samples.
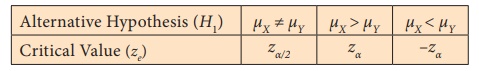
Step-6 :
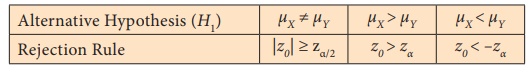
Find the critical value, ze,
corresponding to α and H1 from the following table
Step-7 : Make decision on H0 choosing the suitable
rejection rule from the following table corresponding to H1.
corresponding to H1.
Example 1.10
Performance of students of X Standard in a national level talent
search examination was studied. The scores secured by randomly selected
students from two districts, viz., D1 and D2
of a State were analyzed. The number of students randomly selected from D1
and D2 are respectively 500 and 800. Average scores secured
by the students selected from D1 and D2 are
respectively 58 and 57. Can the samples be regarded as drawn from the identical
populations having common standard deviation 2? Test at 5% level of
significance.
Solution:
Step 1 : Let μX and μY
be respectively the mean scores secured in the national level talent search
examination by all the students from the districts D 1
and D2 considered for the study. It is given that the
populations of the scores of the students of these districts have the common
standard deviation σ = 2. The null and alternative hypotheses are
Null hypothesis: H0: µX = µY
i.e., average scores secured by the students from the study districts
are not significantly different.
Alternative hypothesis: H1: µX ≠ µY
i.e., average scores secured by the students from the study districts
are significantly different. It is a two-sided alternative.
Step 2 : Data
The given sample information are
Size of the Sample-1 (m) = 500
Size of the Sample-2 (n) = 800. Hence, both the samples are
large.
Mean of Sample-1 ( ![]() ) = 58
) = 58
Mean of Sample-2 ( ![]() ) = 57
) = 57
Step 3 : Level of significance
α= 5%
Step 4 : Test statistic
The test statistic under the null hypothesis H0
is
Since both m
and n are large, the sampling
distribution of Z under H0 is the N(0, 1) distribution.
Step 5 : Calculation of Test Statistic
The value of Z is calculated for the given sample
information from
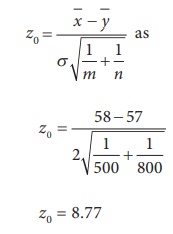
Step-6 : Critical value
Since H1 is a two-sided alternative hypothesis,
the critical value at α = 0.05 is ze = z0.025
= 1.96.
Step-7 : Decision
Since H1 is a two-sided alternative, elements of
the critical region are defined by the rejection rule |z0 | ≥
z e = z0.025. For the given sample
information, |z0| = 8.77 > ze = 1.96. It
indicates that the given sample contains sufficient evidence to reject H0.
Thus, it may be
decided that H0 is rejected. Therefore, the average
performance of the students in the districts D1 and D2
in the national level talent search examination are significantly different. Thus
the given samples are not drawn from identical populations.
Related Topics