Procedure Steps, Example Solved Problems | Statistics - Test of Hypotheses for Population Mean (Population Variance is Unknown) | 12th Statistics : Chapter 1 : Tests of Significance - Basic Concepts and Large Sample Tests
Chapter: 12th Statistics : Chapter 1 : Tests of Significance - Basic Concepts and Large Sample Tests
Test of Hypotheses for Population Mean (Population Variance is Unknown)
TEST OF HYPOTHESES FOR POPULATION MEAN (POPULATION VARIANCE IS
UNKNOWN)
Procedure:
Step 1 : Let µx and σx2 be
respectively the mean and the variance of the population under study, where σ2
is unknown. If µ0 is an admissible value of µ, then frame the
null hypothesis as H0: µ = µ0 and choose the
suitable alternative hypothesis from
(i) H1: µ ≠ µ0 (ii) H1: µ > µ0 (iii) H1: µ < µ0
Step 2 : Let (X1, X2, …, Xn) be a random
sample of n observations drawn from
the population, where n is large (n ≥ 30).
Step 3 : Specify the level of significance, α.
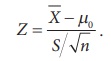
Step 4 : Consider the test statistic Z =  under H0, where
 ![]() and S are the sample mean and sample standard deviation respectively. It may be noted that the above
test statistic is obtained from Z considered in the test described in
Section 1.9 by substituting S for σ.
and S are the sample mean and sample standard deviation respectively. It may be noted that the above
test statistic is obtained from Z considered in the test described in
Section 1.9 by substituting S for σ.
The approximate sampling distribution of the test statistic under H0
is the N(0,1) distribution.
Step 5 : Calculate the value of Z for the given sample (x1,
x2, ..., xn) as  . Here,
 ![]() and s are respectively the
values of
and s are respectively the
values of ![]() and S calculated for the given sample.
and S calculated for the given sample.
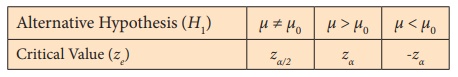
Step 6: Find the critical value, ze, corresponding to α and H1 from the following table
Step
7:
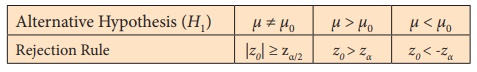
Decide on H0 choosing the suitable rejection rule from the following
table corresponding to H1.
Example 1.9
A motor vehicle manufacturing company desires to introduce a new
model motor vehicle. The company claims that the mean fuel consumption of its
new model vehicle is lower than that of the existing model of the motor
vehicle, which is 27 kms/litre. A sample of 100 vehicles of the new model
vehicle is selected randomly and their fuel consumptions are observed. It is
found that the mean fuel consumption of the 100 new model motor vehicles is 30
kms/litre with a standard deviation of 3 kms/litre. Test the claim of the
company at 5% level of significance.
Solution:
Step 1 : Let the fuel consumption of the new model motor vehicle be assumed
to be distributed according to a distribution with mean and standard
deviation respectively μ and σ. The null and alternative
hypotheses are
Null hypothesis H0: μ = 27
i.e., the average fuel consumption of the company’s new model motor
vehicle is not significantly different from that of the existing model.
Alternative hypothesis H1: μ > 27
i.e., the average fuel consumption of the company’s new model motor
vehicle is significantly lower than that of the existing model. In other
words, the number of kms by the new model motor vehicle is significantly more
than that of the existing model motor vehicle.
Step 2 : Data:
The given sample information are
Size of the sample (n) = 100. Hence, it is a large sample.
Sample mean ( ![]() )= 30
)= 30
Sample standard deviation(s) = 3
Step 3 : Level of significance
α= 5%
Step 4 : Test statistic
The test statistic under H0 is
Since n is large, the sampling distribution of Z
under H0 is the N(0,1) distribution.
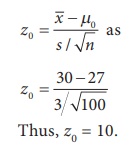
Step 5 : Calculation of Test Statistic
The value of Z for the given sample information is calculated
from
Step 6 : Critical Value
Since H1 is a one-sided (right) alternative
hypothesis, the critical value at α = 0.05 is ze =
z0.05 = 1.645.
Step 7 : Decision
Since H1 is a one-sided (right) alternative,
elements of the critical region are defined by the rejection rule z0
> ze = z 0.05. Thus, it is a right
-tailed test. Since, for the given sample information, z0 =
10 > z e = 1.645, H0 is rejected.
Related Topics