Definition, Example Solved Problems | Statistics - Level of Significance, Critical Region and Critical Value(S) | 12th Statistics : Chapter 1 : Tests of Significance - Basic Concepts and Large Sample Tests
Chapter: 12th Statistics : Chapter 1 : Tests of Significance - Basic Concepts and Large Sample Tests
Level of Significance, Critical Region and Critical Value(S)
LEVEL OF SIGNIFICANCE, CRITICAL REGION AND CRITICAL VALUE(S)
In a given hypotheses testing problem, the maximum probability
with which we would be willing to tolerate the occurrence of type I error is
called level
of significance of the test. This probability is usually denoted by ‘α’.
Level of significance is specified before samples are drawn to test the
hypothesis.
The level of significance normally chosen in every hypotheses
testing problem is 0.05 (5%) or 0.01 (1%). If, for example, the level of
significance is chosen as 5%, then it means that among the 100 decisions of
rejecting the null hypothesis based on 100 random samples, maximum of 5 of
among them would be wrong. It is emphasized that the 100 random samples are
drawn under identical and independent conditions. That is, the null hypothesis H0
is rejected wrongly based on 5% samples when H0 is actually
true. We are about 95% confident that we made the right decision of rejecting H0.
Critical region in a hypotheses testing problem is a subset of
the sample space whose elements lead to rejection of H0. Hence, its
elements have the dimension as that of the sample size, say, n(n >
1). That is,
Critical Region = { x = (x1 , x2 , ..., xn
)| H0 is rejected}
A subset of the sample space whose elements does not lead to
rejection of H0 may be termed as acceptance region, which is the
complement of the critical region. Thus,
S = {Critical Region} U {Acceptance Region}.
Test statistic, a function of statistic(s) and the known value(s)
of the underlying parameter(s),is used to make decision on H0.
Consider a hypotheses testing problem, which uses a test statistic t ( X) and a constant c for deciding on H0
. Suppose that H0 is rejected, when t(x) > c . It is to be
noted here that t ( X) is a scalar and is of dimension one. Its sampling
distribution is a univariate t (X) satisfying the condition t ( x) >
c will identify the probability distribution. The values of samples in the
sample space, which lead to rejection of H0. It does not mean that {
t | t(x) > c } is the
corresponding critical region. The value ‘c’, distinguishing the elements of
the critical region and the acceptance region, is referred to as critical value. There may be one or
many critical values for a hypotheses testing problem. The critical values are
determined from the sampling distribution of the respective test statistic
under H0.
Example 1.4
Suppose an electrical equipment manufacturing industry receives
screws in lots, as raw materials. The production engineer decides to reject a
lot when the number of defective screws is one or more in a randomly selected
sample of size 2.
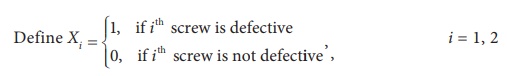
Then, X1
and X2 are iid random variables and they have the Bernoulli (P) distribution.
Let H0 : P = 1/3 and H1
: P = 2/3
The sample space is S
= {(0,0),(0,1),(1,0),(1,1)}
If T(X1, X2) represents
the number of defective screws, in each random sample, then the statistic T(X1,
X2) = X1 + X2 is a random
variable distributed according to the Binomial (2, P)
distribution. The possible values of T(X1, X2)
are 0, 1 and 2. The values of T(X1, X2)
which lead to rejection of H0 constitute the set {1,2}.
But, the critical region is defined by the elements of S corresponding to T(X1,X2)
= 1 or 2.
Thus, the critical region is {(0,1), (1,0), (1,1)} whose dimension
is 2.
Note 8: When the sampling distribution is continuous, the set of values of t ( X) corresponding to the rejection rule will be an interval or union of intervals depending on the alternative hypothesis. It is empahazized that these intervals identify the elements of critical region, but they do not constitute the critical region.
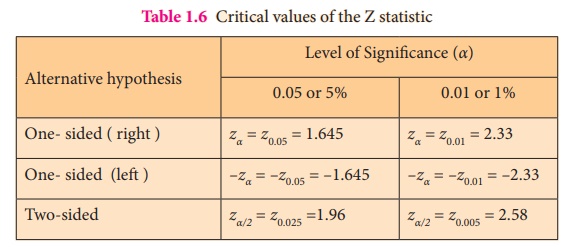
When the sampling distribution of the test
statistic Z is a normal distribution,
the critical values for testing H0
against the possible alternative hypothesis at two different levels of significance,
say 5% and 1% are displayed in Table 1.6.
Table 1.6 Critical values of the Z
statistic
Related Topics