Chapter: 11th 12th std standard Class Organic Inorganic Physical Chemistry Higher secondary school College Notes
Gaseous state - Critical phenomena

Critical phenomena
The essential condition for the liquefaction of the gas is described by
the study of critical temperature, critical pressure and critical volume and
their inter relationships.
When a gaseous system is transformed to its
liquid state, there is a tremendous decrease in the volume. This decrease in
volume can be effectively brought about by lowering of temperature, or by
increasing pressure (or) by both. In both these effects the gaseous molecules
come closer to each other and experience an increase in force of attraction
which results in liquefaction of gases. At any constant temperature when
pressure is increased volume is decreased and vice versa. Such P-V curves at
constant temperature are known as isotherms. A typical isotherm can be
considered similar to Fig.9.2.
The figure 9.2 shows the continuous decrease in
pressure with increase in volume for both ideal and real gases. There is a
definite deviation exhibited by the real gas from ideal gas behaviour at high
pressure and low volumes.
Critical temperature (Tc)
It is defined as the characteristic temperature
of a gas at which increase in pressure brings in liquefaction of gas above
which no liquefaction occurs although the pressure may be increased many fold.
For instance Tc of CO2 is 31.1 o C. This means that it is not possible to liquefy
CO2 by applying pressure when its temperature is above 31.1 o C.
Critical pressure (Pc)
It is defined as the minimum pressure required
to liquefy 1 mole of a gas present at its critical temperature.
Critical volume (Vc)
The volume occupied by 1 mole of a gas at its
critical pressure and at critical temperature is the critical volume (Vc) of
the gas.
A gas is said to be at its critical state when its pressure, volume and temperature are Pc, Vc
and Tc.
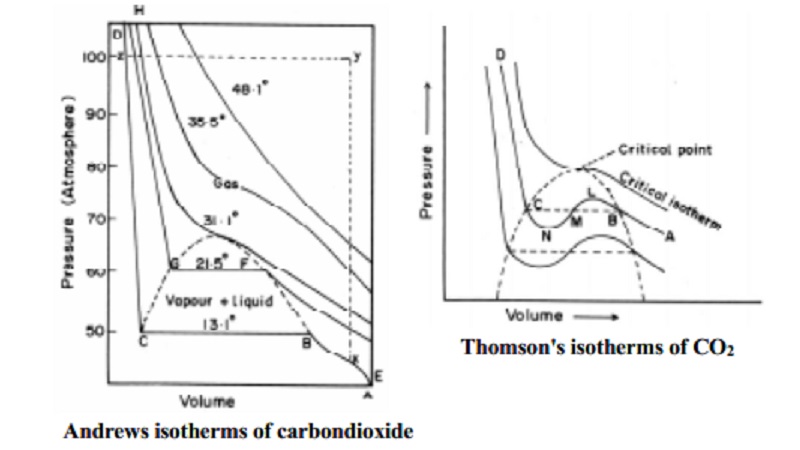
1)Andrews isotherms of
carbondioxide
The
importance of critical temperature of a gas was first discovered by Andrews in
his experiments on pressure - volume isotherms of carbon dioxide gas at a
series of temperature. The isotherm of carbondioxide determined by him at
different temperatures are shown in Fig.
Consider first the isotherm at the temperature 13.1 o C. The point A represents carbondioxide in the
gaseous state occupying a certain volume under a certain pressure. On
increasing the pressure its volume diminishes as is indicated by the curve AB.
At B, liquefaction of gas commences and thereafter a rapid decrease in the
volume takes place at the same pressure, since more and more of the gas is
converted into the liquid state. At C, the gas becomes completely liquefied.
After `C' the increase of pressure produces only a very small decrease in
volume. This is shown by a steep line CD which is almost vertical. Thus, along
the curve AB, carbon dioxide exist as gas. Along BC, it exists in equilibrium
between gaseous and liquid state. Along CD it exists entirely as a liquid. The
isotherm at 21.5 o C shows
that the decrease in volume becomes smaller because higher the temperature
greater is the volume. Therefore more pressure is applied to decrease the
volume. This effect makes liquefaction to commence at higher pressure compared
to the previous isotherm at 13.1 o C.

At still higher temperature, the horizontal
portion of the curve becomes shorter and shorter until at 31.1 o C it reduces to a point. The temperature 31.1 o C is regarded as the critical temperature of CO2.
At this temperature, the gas passes into liquid imperceptibly. Above 31.1 o C the isotherm is continuous. CO2 cannot be
liquefied above 31.1 o C no
matter how high the pressure may be. The portion of area covered by curve H
with zyx portion always represents the gaseous state of CO2.
2) Continuity of state
Thomson's experiment
Thomson (1871) studied the isotherm of CO2
drawn by Andrews. He suggested that there should be no sharp points in the
isotherms below the critical temperature. These isotherms should really exhibit
a complete continuity of state from gas to liquid. This, he showed as a
theoretical wavy curve. The curve MLB in Fig.9.7 represents a gas compressed in
a way that it would remain stable. The curve MNC represents a superheated
liquid because compression above Tc, leads to heating effects. This type of
continuity of state is predicted by Vanderwaal's equation of state which is
algebraically a cubic equation. The Vanderwaal's equation may be written as
PV3 - (RT + Pb) V2 + aV - ab = 0
Thus, for any given values of P and T there should
be three values of V. These values are indicated by points B,M and C of the
wavy curve. The three values of V become closer as the horizontal part of the
isotherm rises. At the critical point the three roots of Vanderwaal 'V' become
identical and there is no longer any distinction between the gas and liquid
states. Here, the gas is said to be in critical state. This effect enables the
calculation of Tc, Pc and Vc in terms of Vanderwaal's constants.

3) Derivation of
critical constants from Vanderwaal's constants
Let us derive the values of critical constants Tc
(critical temperature), Vc (critical volume) and Pc
(critical pressure) in terms of the Vanderwaal's constants `a' and `b'. The
Vanderwaal's equation is given by
Tc =8a / 27Rb
Hence the critical constants can be calculated using the values of
Vanderwaal's constants of a gas and vice versa. Since Pc and Tc
can often be determined experimentally, these values may be employed to
calculate the constants a and b.
a = 3Vc2 Pc
b = Vc /3
Based on the critical temperature values, gases are categorised as
"permanent" and "temporary" gases. H2, N2,
He, .... gases having very low critical temperature belong to the permanent
type. Gases like NH3, CO2, SO2, HCl etc.
having critical temperature in the ordinary range of temperatures belong to the
temporary gases type.
Related Topics