Chapter: Civil : Construction Planning And Scheduling
Schedule Control
Schedule Control
In addition to cost control, project managers must
also give considerable attention to monitoring schedules. Construction
typically involves a deadline for work completion, so contractual agreements
will force attention to schedules. More generally, delays in construction
represent additional costs due to late facility occupancy or other factors.
Just as costs incurred are compared to budgeted costs, actual activity durations
may be compared to expected durations. In this process, forecasting the time to
complete particular activities may be required.
The
methods used for forecasting completion times of activities are directly
analogous to those used for cost forecasting. For example, a typical estimating
formula might be:
(3.5) D = Wht
where Df
is the forecast duration, W is the amount of work, and ht is the
observed productivity to
time t. As with cost control, it is important to devise
efficient and cost effective methods for gathering information on actual
project accomplishments. Generally, observations of work completed are made by
inspectors and project managers and then work completed is estimated as
described in Section 12.3. Once estimates of work complete and time expended on
particular activities are available, deviations from the original duration
estimate can be estimated. The calculations for making duration estimates are
quite similar to those used in making cost estimates in Section 133.
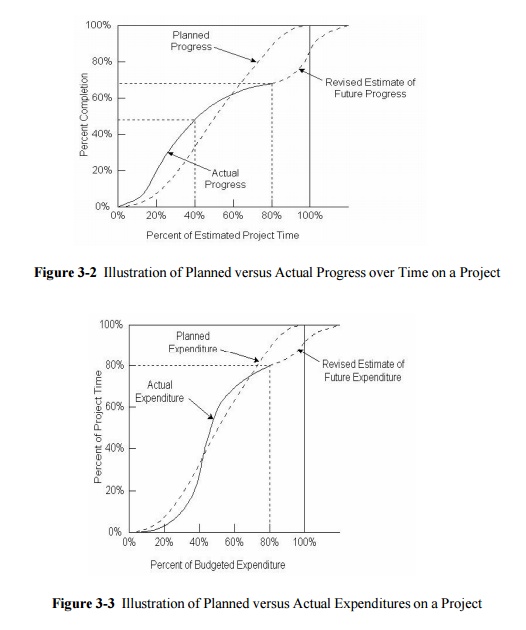
For example, Figure 3.2 shows the originally
scheduled project progress versus the actual progress on a project. This figure
is constructed by summing up the percentage of each activity which is complete
at different points in time; this summation can be weighted by the magnitude of
effort associated with each activity. In Figure 3-2, the project was ahead of
the original schedule for a period including point A, but is now late at point
B by an amount equal to the horizontal distance between the planned progress
and the actual progress observed to date.
Schedule adherence and the current status of a
project can also be represented on geometric models of a facility. For example,
an animation of the construction sequence can be shown on a computer screen,
with different colors or other coding scheme indicating the type of activity
underway on each component of the facility. Deviations from the planned
schedule can also be portrayed by color coding. The result is a mechanism to
both indicate work in progress and schedule adherence specific to individual
components in the facility
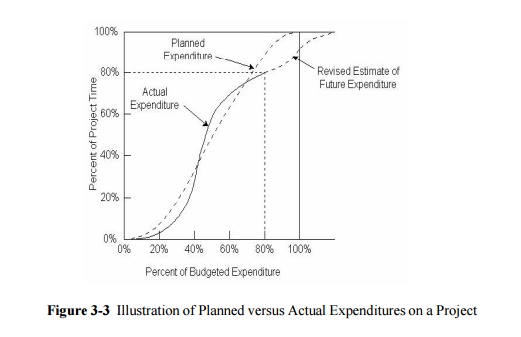
In
evaluating schedule progress, it is important to bear in mind that some
activities possess float or scheduling leeway, whereas delays in activities on
the critical path will cause project delays. In particular, the delay in
planned progress at time t may be soaked up in activities' float (thereby
causing no overall delay in the project completion) or may cause a project
delay. As a result of this ambiguity, it is preferable to update the project
schedule to devise an accurate protrayal of the schedule adherence. After
applying a scheduling algorithm, a new project schedule can be obtained. For
cash flow planning purposes, a graph or report similar to that shown in Figure
12-3 can be constructed to compare actual expenditures to planned expenditures
at any time. This process of re-scheduling to indicate the schedule adherence
is only one of many instances in which schedule and budget updating may be
appropriate, as discussed in the next section.
Related Topics