Chapter: Mechanical : Maintenance Engineering : Maintenance Policies and Preventive Maintenance
Project Scheduling
Scheduling
Techniques
Scheduling
is one of the areas that received considerable attention from researchers as well
as practitioners in all types of applications including operations scheduling
and project scheduling. Techniques are developed to develop optimum or near
optimal schedules with respect to different possible performance measures. This
chapter highlights some of these techniques and their application in
maintenance scheduling.
Project Scheduling
Maintenance activities commonly take the form of a
project with many dependent operations forming a network of connected
operations. In such cases, project management techniques can be utilized for
scheduling the maintenance operations. The two primary network programming
techniques used in project scheduling are the critical path method (CPM) and
program evaluation and review technique (PERT). Each was developed
independently during the late 1950s. The main difference between the two is
that CPM uses a single estimate of activity time duration while PERT uses three
estimates of time for each activity. Hence, CPM is considered to be a
deterministic network method while PERT is a probabilistic method. Both
networks consist of nodes representing activities and arrows indicating
precedence between the activities. Alternatively, arrows may represent
activities and nodes represent milestone. Both conventions are used in
practice. Here we are going to use the former.
The
objective in both CPM and PERT is to schedule the sequence of work activities
in the project and determine the total time needed to complete the project. The
total time duration is the longest
sequence of activities in the network (the longest
path through the network diagram) and is called the critical path. Before we
proceed by explaining the two methods it is worth noting that PERT and CPM are
not well suited for day-to-day independent small jobs scheduling in a
maintenance department. However, they are very useful in planning and
scheduling large jobs (20 man hours or more) that consist of many activities
such as machine overhauls, plant shut downs, and turnaround maintenance
activities. Furthermore, a prerequisite for the application of both methods is
the representation of the project as a network diagram, which shows the
interdependencies and precedence relationships among the activities of the
project.
Formulating the maintenance
project as a network diagram helps in viewing the whole project as an
integrated system. Interaction and precedence relationships can be seen easily
and be evaluated in terms of their impact on other jobs. The project network
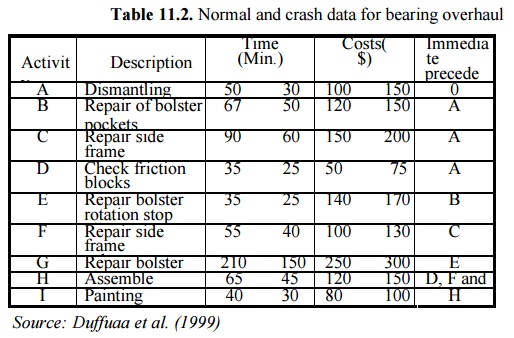
representation will be demonstrated by an example from maintenance. Table 11.2
shows the data for overhauling a bearing in a train cargo carriage. The data
shows the normal, crash duration, their corresponding costs, and precedence
relationships for each activity. The term crash time refers to the minimum time
the job can be accomplished in (by committing more resources), beyond which no
further reduction in the job duration can be achieved. At this duration any
increase in the resources for this job will increase the cost without reducing
the duration.
Table
11.2. Normal and crash data for bearing overhaul
Figure
11.8 shows the network corresponding to the data in the table. It starts with
node A with no predecessor activity and it is represented by a circle nearby a
number indicating the time. A itself is a predecessor for three activities B,
C, and D drawn as three circles connected to A by arrows to indicate the
precedence relation with A. Other activities (nodes) are traced back similarly.
The resulting network is terminated by node I that has no successor.
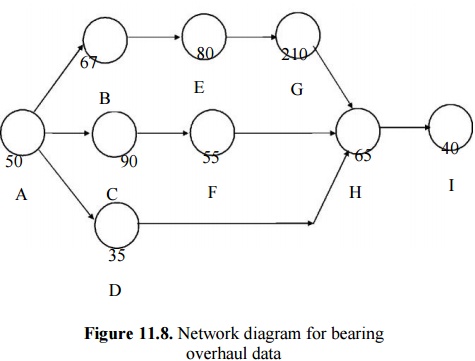
Figure 11.8. Network
diagram for bearing overhaul data
There are many paths through the
network in Figure 11.8 starting from the first node to the last node. The
longest one is called the critical path and the summation of the activity times
along that path is the total project duration. Jobs in the critical path are
called critical in the sense that any delay in these jobs would cause a delay
in the whole project. All other paths include slack times (sometimes called
floats), i.e., the amount of extra time that activities in the path can
be delayed without delaying the completion time of the whole project.
Activities that are not in the critical path may have some slack times, i.e.,
delaying this activity for one reason or another will not delay the whole
project. In this example there are three possible paths shown in Table 11.3.
Critical activities must be monitored carefully and adhere to their specified
schedules; however, non-critical activities can be used for leveling the
resources due to the available slacks.
Table
11.3. Possible paths for completing bearing overhaul
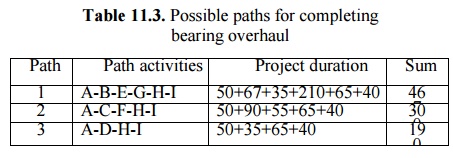
Clearly
the project duration is 467 min and the critical path is the first path (A-
B-E-G-H-I). Paths 2 and 3 have slacks of 167 and 277 min respectively. In this
example, it was easy to go through all possible paths to find the one with the
longest time; however, it would be extremely difficult to do the same for
larger projects having a large number of activities and more complicated between
them. A systematic approach for identifying the critical path is known as the
critical path method (CPM).
Related Topics