Chapter: The Diversity of Fishes: Biology, Evolution, and Ecology: Fish genetics
Population genetics - Fish genetics
Population genetics
This area of study uses genotype frequencies to distinguish populations. Populations (in the genetic sense) are groups of interbreeding individuals that rarely exchange members with other populations. Population genetic principles are often applied to fisheries’ management, to define the stocks that are the units of harvest and management. Populations are important management units because if one population is depleted, it must recover alone, without being replenished from other populations.
Genetic differences between populations of fishes can range from restricted gene flow between adjacent locations (shallow population structure, see below) to ancient separations indicated by diagnostic differences in DNA sequences (deep population structure, see below). At the lower end of this spectrum, population-level separations are indicated by significant differences in the frequency of alleles (in nDNA) or haplotypes (in mtDNA). Populations separated by habitat discontinuities (especially in fresh water) or great distances (especially in the ocean) will not freely interbreed, and the consequence of this restriction is usually that the populations “drift” apart in terms of genetic composition. Sometimes these separations are reinforced by natural selection, but often the changes in allele frequencies are due to chance, when one allele at a given locus increases or decreases in one population, and a different allele increases or decreases in another population. As noted below, the level of separation is commonly measured with F statistics (FST, see below) and various analogs, especially ΦST for DNA sequence data, with larger values indicating greater genetic isolation.
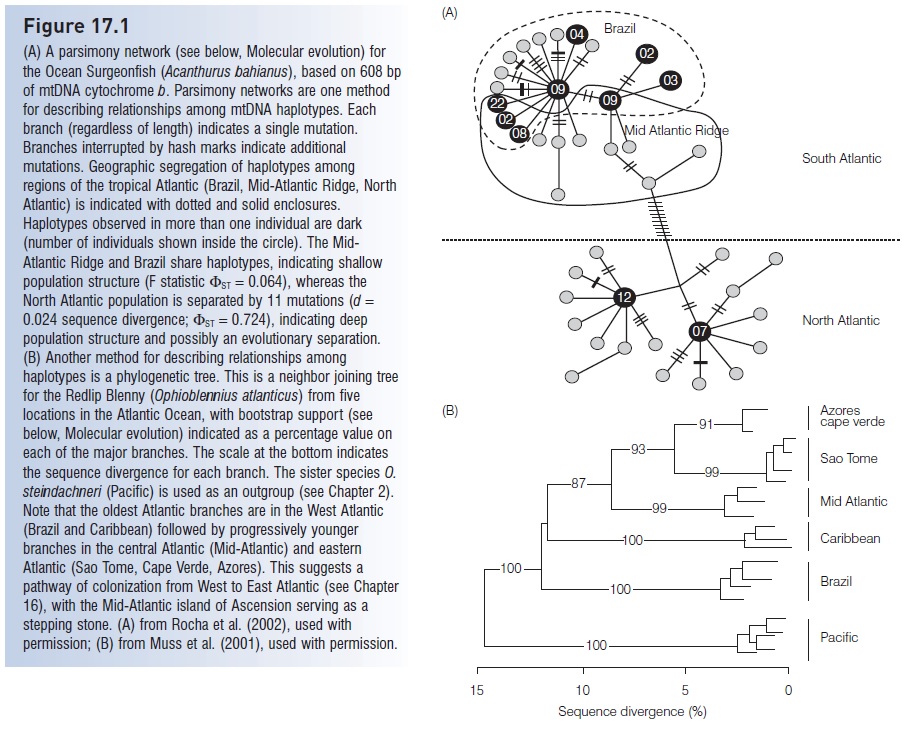
Figure 17.1
(A) A parsimony network (see below, Molecular evolution) for the Ocean Surgeonfish (Acanthurus bahianus), based on 608 bp of mtDNA cytochrome b. Parsimony networks are one method for describing relationships among mtDNA haplotypes. Each branch (regardless of length) indicates a single mutation. Branches interrupted by hash marks indicate additional mutations. Geographic segregation of haplotypes among regions of the tropical Atlantic (Brazil, Mid-Atlantic Ridge, North Atlantic) is indicated with dotted and solid enclosures. Haplotypes observed in more than one individual are dark (number of individuals shown inside the circle). The Mid-Atlantic Ridge and Brazil share haplotypes, indicating shallow population structure (F statistic ST =0.064), whereas the North Atlantic population is separated by 11 mutations (d =0.024 sequence divergence; ST =0.724), indicating deep population structure and possibly an evolutionary separation. (B) Another method for describing relationships among haplotypes is a phylogenetic tree. This is a neighbor joining tree for the Redlip Blenny (Ophioblennius atlanticus) from five locations in the Atlantic Ocean, with bootstrap support (see below, Molecular evolution) indicated as a percentage value on each of the major branches. The scale at the bottom indicates the sequence divergence for each branch. The sister species O. steindachneri (Pacific) is used as an outgroup. Note that the oldest Atlantic branches are in the West Atlantic (Brazil and Caribbean) followed by progressively younger branches in the central Atlantic (Mid-Atlantic) and eastern Atlantic (Sao Tome, Cape Verde, Azores). This suggests a pathway of colonization from West to East Atlantic, with the Mid-Atlantic island of Ascension serving as a stepping stone. (A) from Rocha et al. (2002), used with permission; (B) from Muss et al. (2001), used with permission

Dispersal and population structure
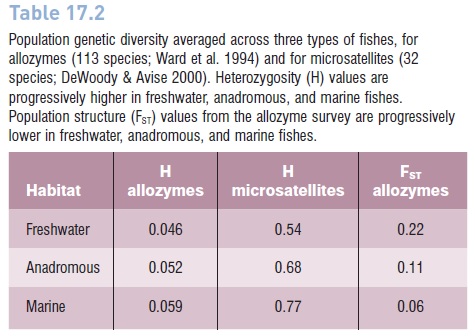
Certain life history traits correspond to shallow or deep population structure, especially those that influence the ability of the fish to disperse, as larva, juvenile, or adult. Hence the first generalization is that levels of population genetic structure are lowest in marine fishes, intermediate in anadromous fishes, and highest in freshwater fishes (Table 17.2). Sonoran topminnows (Poeciliopsis occidentalis) in the southwestern United States, that occupy desert springs separated by a few kilometers, can be isolated for thousands of years (Quattro et al. 1996). In this topminnow and other desert fishes, dispersal opportunities are limited to rare flooding events. At the other end of the spectrum, the Whale Shark (Rhincodon typus) has population structure only on the global scale of Atlantic versus Indo-Pacific oceans (Castro et al. 2007).
Genetic diversity (heterozygosity H) also shows a rank order among freshwater (lowest), anadromous (intermediate), and marine (highest) fishes. This is an expected consequence of tremendous differences in population size.
Freshwater populations may number in the thousands to millions, whereas their marine counterparts, with much larger ranges, may number in the millions to (in the case of anchovies and sardines) billions. Larger populations will accumulate more genetic diversity (Kimura 1983). There are many exceptions to these trends, but the conclusion of a rank order in genetic diversity is supported by both allozymes and microsatellite surveys (Table 17.2).
If populations are isolated for thousands of generations, they will eventually reach monophyly (see Deep population stucture entry above). The rate at which populations diverge depends on the effective population size (Ne), with a high probability of monophyly after 4Ne generations (Neigel & Avise 1986). Often the condition of monophyly is accompanied, upon closer examination, by morphological differences that indicate previously unrecognized cryptic species. However, this is not invariably the case, and scientists may prefer to retain a single taxonomic label that recognizes multiple evolutionary (subspecific) units within a species. The term evolutionary significant unit (ESU) was coined for subspecific evolutionary entities that show morphologiand
Table 17.2
Population genetic diversity averaged across three types of fishes, for allozymes (113 species; Ward et al. 1994) and for microsatellites (32 species; DeWoody & Avise 2000). Heterozygosity (H) values are progressively higher in freshwater, anadromous, and marine fishes. Population structure (FST) values from the allozyme survey are progressively lower in freshwater, anadromous, and marine fishes.

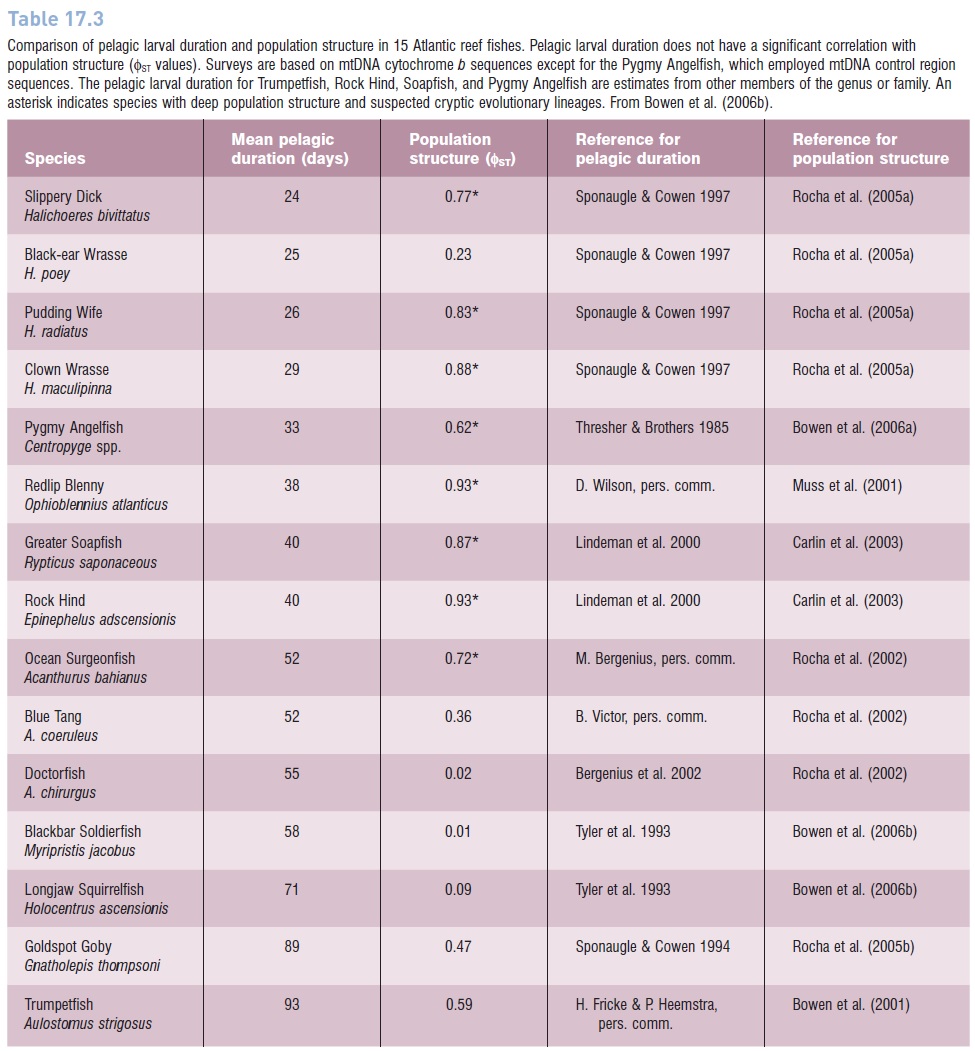
Table 17.3
Comparison of pelagic larval duration and population structure in 15 Atlantic reef fishes. Pelagic larval duration does not have a significant correlation with population structure (ΦST values). Surveys are based on mtDNA cytochrome b sequences except for the Pygmy Angelfish, which employed mtDNA control region sequences. The pelagic larval duration for Trumpetfish, Rock Hind, Soapfish, and Pygmy Angelfish are estimates from other members of the genus or family. An asterisk indicates species with deep population structure and suspected cryptic evolutionary lineages. From Bowen et al. (2006b).

ESUs are often applied in the context of conservation, with an emphasis on higher priorities for ESUs than for populations, as has been applied to Pacific salmonids (see below). While monophyly in DNA assays is not the only way to assign such conservation priorities, this criterion is valuable for distinguishing populations that may have novel genetic characteristics, and may be in the process of speciating. ESUs as defined by monophyly of mtDNA sequences are surprisingly common in fishes, as indicated in Table 17.3, where eight out of 15 surveys of Atlantic reef fishes show evidence of ESUs.
Pelagic larval duration and population structure
The low level of population structure in marine fishes is a consequence of high dispersal, although other factors such as large population size may contribute to this trend. With few hard barriers in the ocean, and with pelagic larval periods ranging from a few days to 2 years, marine fishes have tremendous potential for dispersal. However, recent modeling and field work have disputed the conclusion that all coastal marine fishes have large “open” populations (Cowen 2002; Mora & Sale 2002; Swearer et al. 2002;Jones et al. 2005). Mark/recapture studies have demonstrated a surprising retention of larvae near their region of origin. Taylor and Hellberg (2005) show genetic partitions on a scale of tens of kilometers in the Caribbean cleaner gobies (Elacatinus spp.), and as noted in the molecular ecology section above, marine mouth-brooders (family Apogonidae) and pouch-brooders (family Syngnathidae) can have very strong population differences due to limited dispersal as both young and adults (Lourie et al. 2005). On the other hand, some apparently sedentary reef fishes can have little population structure across huge swaths of ocean. The pygmy angelfishes (genusCentropyge) show no structure across the central and West Pacific, and across the entire tropical West Atlantic, apparently due to oceanic dispersal of larvae (Bowen et al. 2006a; Schultz et al. 2007). Some fishes may transform from larvae to juveniles but remain in the open ocean for an extended period, as is apparently the case for soldierfishes (genus Myripristis), which show no population structure across the entire tropical Atlantic, and across the central and West Pacific (Bowen et al. 2006b; Craig et al. 2007).
Several researchers have made multispecies comparisons of pelagic larval duration (PLD) and population structure (measured with F statistics) to forge the intuitive links between PLD, dispersal, and population structure. It seems obvious that if larvae are drifting with oceanic currents, the longer pelagic duration will yield greater dispersal and less population structure. Indeed the first comparisons of pelagic larval duration and genetic connectivity in marine fishes supported this connection. Waples (1987) surveyed 10 species in the eastern Pacific, Doherty et al. (1995) surveyed seven species on the Great Barrier Reef, and both of these allozyme studies found a correlation between PLD and population genetic structure. However, subsequent studies have not replicated this correlation. In surveys of eight reef fishes in the Caribbean Sea (Shulman & Bermingham 1995), eight species on the Great Barrier Reef (Bay et al. 2006), and 15 reef species in the tropical Atlantic (Bowen et al. 2006b), no significant correlation was observed between PLD and population genetic structure (Table 17.3).
What can explain these contradictory results? The explanation likely includes at least three components:
1 The two studies that report a significant correlation between PLD and genetic connectivity (Waples 1987; Doherty et al. 1995) are anchored by species that lack a pelagic dispersive stage, and the significant relationship is weakened or lost without these cases (Bohonak 1999; Bay et al. 2006). Therefore it appears that PLD has some influence on population structure, as is most apparent in the fishes with very short or very long pelagic stages. However, other life history factors such as habitat specificity and larval behavior (see below) are involved as well (Riginos & Victor 2001; Rocha et al. 2002).
2 Fish larvae are not “drift bottles” at the mercy of ocean currents. A growing body of evidence demonstrates that they can swim against currents, navigate, and in some cases remain in the vicinity of appropriate juvenile habitats (Leis & Carson-Ewart 2000b; Sweareret al. 2002).
3 Most of the comparisons are among reef fishes, a category that is not cohesive in any phylogenetic or taxonomic sense. The reef fishes includes lineages that diverged from one another 100+million years before present (Bellwood & Wainwright 2002). Such relatively great age of separation in other taxonomic groups would mandate comparisons between wolves and baboons, for example. Marine fishes are too diverse to expect a simple relationship between larval duration and dispersal.
Habitat preference
In resolving population structure of marine fishes, most attention has focused on the dispersive larval stage. However the movements and feeding activities of adults play a role in shaping population structure, especially for fishes in the pelagic zone. For example, population structure in wide-ranging tunas, billfishes, and pelagic sharks is usually measured on the scale of ocean basins: East versus West Atlantic in the Bluefin Tuna Thunnus thynnus (Carlsson et al. 2007), North versusSouth Atlantic in the White Marlin Tetrapturus albidus (Graves & McDowell 2006), Indian versus Pacific in the Swordfish Xiphias gladius (Lu et al. 2006), and Atlantic versus Indian-Pacific in the Whale Shark Rhincodon typus (Castro et al. 2007).
A few demersal (bottom-dwelling) fishes conduct reproductive or seasonal migrations, but most are sedentary, and for this reason the corresponding habitat preferences are seldom considered in predicting population structure. However, habitat preference can have a strong influence on the distribution of genetic diversity in fishes. Usually ecosystem specialists (those with very specific feeding or habitat requirements) have more population structure than generalists, as demonstrated by genetic comparisons of reef .fishes across the Amazon barrier. This turbid plume of fresh water was long regarded as a barrier that divided the West Atlantic reef fauna into northern (Caribbean) and southern (Brazilian) provinces. However, fresh water is less dense than salt water, and may form a surface layer with a saltwater “wedge” below. Trawl surveys conducted under the Amazon plume demonstrated the presence of many marine fishes that are usually associated with coral reefs (Collette & Rützler 1977). An mtDNA survey of West Atlantic wrasses (genus Halichoeres) across the Amazon barrier demonstrates a strong connection between habitat use and genetic structure.Halichoeres maculipinna, a reef species with specialized diet and feeding morphology, has an ancient evolutionary separation between Brazil and the Caribbean (sequence divergence d =0.065 in cytochrome b). In contrast, H. bivittatus is found in a variety of habitats in addition to coral reefs and shows no strong genetic separation across the Amazon barrier (Rocha et al. 2005a). Notably, H. bivittatus was collected in the trawl surveys under the Amazon plume, whereas H. maculipinna was not. Combined, these genetic and field studies indicate that habitat preference and speciesecology can be as important as geography and larval dispersal in defining the distribution of genetic diversity in fishes (Choat 2006).
Complex population structure
In migratory fishes, the resolution of populations (and corresponding management units) can be confounded by two factors:
1 Migratory overlap, in which populations mingle in feeding habitats or during migrations. Examples of such overlap can be found in the anadromous Sockeye Salmon (Oncorhynchus nerka; Grant et al. 1980) and Striped Bass (Morone saxatilis; Wirgin et al. 1997), as well as marine species such as the Bluefin Tuna (Thunnus thynnus; Carlsson et al. 2007) and possibly
cod (Gadus morhua; Svedäng et al. 2007). When independent breeding populations overlap at shared feeding habitats, a critical question is whether genetic exchange occurs. If fish are not breeding during the period of overlap, those populations could be isolated management units.
2 Sex-biased dispersal, in which gene flow between populations is accomplished primarily by one gender. For many mammals and birds, males disperse prior to reproduction, while females remain in natal areas (Greenwood 1980).
Both population overlap and sex-biased dispersal are common in migratory marine fishes. Female site fi delity can be countered by opportunistic mating by males, so that each gender yields a different population genetic signal. This is known as complex population structure (Bowen et al. 2005), and the most common outcome is that female-inherited mtDNA shows population structure while biparentally inherited nDNA surveys show no structure (Goudet et al. 2002). This pattern is apparent in the Brook Charr (Salvelinus fontinalis; Fraser et al. 2004), Patagonian Toothfish (Dissostichus eleginoides; Shaw et al. 2004), and Shortfin Mako Shark (Isurus oxyrinchus; Schrey & Heist 2003). In a survey of White Sharks (Carcharodon carcharias) in the Indian Ocean, the mtDNA sequences reveal significant population structure (Fst =0.81 between South Africa and Australia), while a microsatellite survey indicated a single population (Pardini et al. 2001). For these cases, dispersal by males can readily explain the lower population structure registered in nDNA relative to mtDNA.
Related Topics