Chapter: Basic Concept of Biotechnology : Tools and Techniques in Biotechnology
Polymerase Chain Reaction(PCR) - Techniques of Biotechnology and Innovations
POLYMERASE CHAIN REACTION
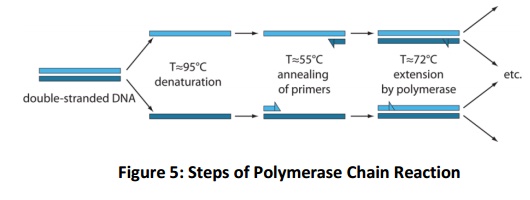
Polymerase chain reaction is better known as PCR, the process is of chain reaction which amplifies the small quantity of starting material to larger number. The technique used to amplify the DNA fragment to simply create multiple copies of a portion of DNA or to compare two different samples of DNA to know which is the more abundant or to find out the similarity between the two/ more than two genotypes. The reaction is performed by DNA polymerase enzyme where it synthesis the complementary DNA strand by extending the DNA strand from free –OH molecule at the starting point. The free –OH molecule provides by a small piece of DNA strand, called as primer. The primer is an oligonucleotide about 10-25 bp in size and binds to its complementary DNA strand and facilitate to amplify it to large number. The process involves the series of steps viz., denaturation of DNA template, primer annealing and extension of DNA strand from free 3’ –OH group of primer. These three processes are repeated for few cycles so that the copy number of the template increases. The three steps operate at theirown temperature like for denaturation of DNA requires the 94oC to break the hydrogen bonds between the complementary strands and in contrast to it facilitating the condition to form the hydrogen bonds between the primer (~50oC) and template. The annealed primer will be extended by polymerase enzyme (~72oC). The polymerase enzyme produces the complementary strand by incorporating the complement nucleotide of the template to the existing free 3’-OH of the primer. Hence, series of amplicons will produce in a short time by repeating the cycle of temperatures. The first amplicon produced in the third cycle from than onwards its copy number doubles as the cycle progress for example- in fourth cycle 2 copies, in fifth cycle 4 copies, in sixth cycle 8 copies and so on. At the nth cycle the number of copy produced will be 2(n+1), where “n” is number of cycles.
Components of PCR
1) DNA polymerase
As the temperature in the reaction rises to 94-95oC, the components used in the reaction should retain their activity. Hence, Taq polymerase isolated from Thermus aquaticus, which will not losethe confirmation at the higher temperature. In general, the 1 unit (U) of DNA polymerase able to amplify the 1 Kb of amplicon based on that the quantity of enzyme varies, 0.5-2.5 U of enzyme used for 20-50 µl of reaction. The different type of polymerase enzymes are available commercially those may varies with respect to fidelity and efficiency of polymerization.
2) Primer
The nucleotide sequences in the primer decide the region to be amplified. The primers may be 10 to 25 nucleotides; size varies with the purpose of the amplification. The arbitrary primers usually 10 nucleotides in size and primers to gene specific will be 18-25 nucleotides long. The annealing temperature of the primer to the target template depends on the nucleotide composition of the primers. In general, a set of primer is used to amplify a region, like forward and reverse primer. For better amplification, the difference between the annealing temperature of forward and reverse primers should not be exceed the 5oC. As the polymerase begins with free –
OH group from 3’ end of the. The primer’s 3’ end most important than 5’ and it should be perfectly anneal to the template and it is better to design with the G/C end. The 5’ end is freely available, this end can be used to attach for any modifications like attachment of restriction sites/ nucleotide labeling. While designing the primers these points should be considered. The 5-10 pmol concentration of primers is routinely used for normal 20-50 µl PCR. Even the excess primer concentration inhibits the amplification sequestering the buffer component (Mg+2) as a result Taq polymerase faces the shortage of buffer component (Mg2+) for amplification.
3) Deoxynucleoside triphosphates (dNTPs)
The building blocks of DNA i.e., dNTPs, are adenine, guanine, thymine and cytosine are arranged randomly with meaningful functions in the DNA. Hence, while amplifying the DNA under in vitro conditions the all four nucleotide added to PCR in an equimolar concentration. The 1 mM-2 mM are generally used for each reaction of PCR and it sufficient to amplify the 1 kB of DNA template. High concentrations of dNTPs (>4mM) are inhibitory, perhaps because of sequestering of Mg2+.
4) Buffer
The pH of buffer between the 8.3- 8.8 is congenial to Taq polymerase to carry out the amplification. The enzyme supplied in 10 X concentration, the 1 X concentration is sufficient for amplification.Now-a-days, divalent cation is added to the buffer the concentration of 1.5 mM of divalent cation (Mg2+) is sufficient for the PCR.
PCR programme
The PCR starts with initial denaturation of template DNA with 94-95oC for 5-10 min depending upon the G+C content of the sample. 5 min is preferentially used which is sufficient to denature the genomic DNA. Followed by this step, cycle of different temperature begins. The cycle (Fig. 5), begins with 94-95oC for 45 sec, ~50oC for 45 sec facilitate for primer annealing (varies, depends on primer G+C content) and extension step for amplification of single strand it is performed at 72oC for 45 sec. this cycle will be repeated for 28-32 cycle for sufficient quantity of amplicons. As the number of cycles progressed, the amplification efficiency comes down due to exhausting of substrate molecule of PCR. Hence, it is better to do with optimum number of cycles (28-32).

qRT-PCR
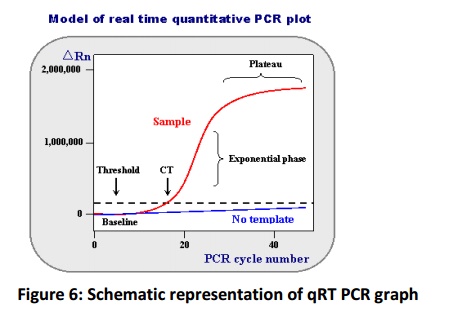
Routinely the PCR products will be analysed in a separate procedure, which performed after the reaction completion. This type of analysis is called as end point analysis but this method is most suitable to present the presence or absence of a product on horizontal gel electrophoresis. The accurate quantification by this method possessseveral disadvantages inaccurate quantification initial template copy number because as reaction progress to (30-40 cycle) the availability of polymerase substrate become limited for polymerase reaction and accumulation of inhibitors, hence the amplification will not progress in an exponential rate and amplification reaches plateau phase (Fig. 6). Quantifying after this phase yields poor results therefore it is essential to quantify cDNA template at an exponential phase, achieved by monitoring the amplification rate by use of a fluorescent dyes and measuring their signals by high resolution cameras. This procedure is known as real time quantification. SYBR green is most commonly using fluorescent dye that binds to only double stranded DNA and emits the fluorescence. In PCR as the double strand DNA synthesis progressed the binding of SYBR green dye to dsDNA increases and emits more fluorescence, which will be measured in real time later used for quantification of initial copy number fold change of a template by use of a mathematical formula (Ramakers et al., 2003, Czechowski et al., 2004). Apart from reaction, the template integrity, concentration and primer concentration plays a major role in quantification.

The exponential growth phase will be used for quantification of target gene concentration. Where, ΔRn is incremental in fluorescent signal at each time point, Ct is cycle threshold value. The ΔRn plotted against PCR cycle number to obtain PCR amplification curve.
Primer designing
The primers pairs can be designed by Primer3Plus software. A predicted melting temperature (Tm) of 60+2oC, primer lengths of 20-24 nucleotides, guanine-cytosine (GC) contents of 45-55 % and PCR amplicon length of 100-200 bp is optimum for designing the primer pairs. The specificity of primer pairs can be further reconfirmed by searching homology in NCBI, BLAST search.
Template concentration standardization
In real-time quantitation of any gene expression, template concentration is one of the key factors to consider. The different concentration 10 ng, 1 ng, 0.1 ng, 0.01 ng and 0.001 ng of a gene need to optimize the amplification. Template concentration which gives the low threshold value (Ct) and high fluorescence value can be further used for remaining samples.
Primer concentration standardization
In real-time quantitation of any gene expression, primer concentration is one of the key factors.Primer concentrations of 1 pmol, 5 pmol, 10 pmol and 15 pmol are generally used to optimize the amplification. Primer concentration which gives the amplification with low Ct value and high fluorescence value is generally used for remaining genes.
qRT-PCR reaction
The master mix of different components of real-time PCR was prepared fresh to avoid handling errors. The reaction carried out in two technical replications and two biological replications. At each time, a minimum of 10 µl reaction mixture prepared containing desired concentration of cDNA template (1 µl), a pair of (5 pmol) gene specific primers (0.5 µl each), 5 µl of 2X SYBR green reagents and desired amount of sterile, nuclease free water. The PCR program followed was, initial denaturation temperature of 95oC for 10 min, followed by denaturation at 95oC for 15 sec, primer annealing temperature with annealing time 20 sec, extension at 72oC for 20 sec. Run the reaction in thermal cycler instrument, which can be able to detect the fluorescent molecules (Eppendrof mastercycler ep realplex thermal cycler instrument).
Setting the baseline and threshold level
The accurate threshold level is measured with respect to point at which SYBR green fluorescence signals of amplification crosses the background signals. The background signals arise because of the changes in the reaction conditions, media and environment. During the PCR, at a cycle the signals will be high and cross the threshold line that particular cycle number will be measured by Eppendrof mastercycler ep realplex signal detection software and denoted as Ct value. The default value will be 3-15 cycles.
Relative gene quantification analysis
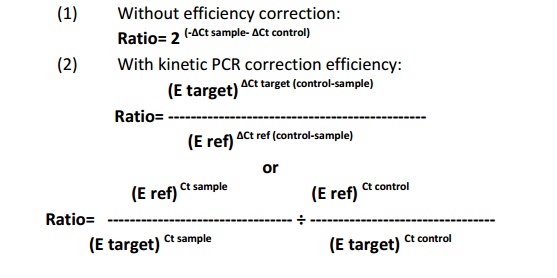
Relative quantification determines change in steady state mRNA levels of gene/s in a sample or multiple samples and express it relate to the level of internal control RNA. The most of the cases internal control will be of housekeeping genes which know to be express uniformly in cell even under different conditions. Relative quantification based onexpression level of target gene and internal control gene. Hence, preparation of calibration curve is not essential for this strategy. The various mathematical formulas are available to calculate the fold change in gene expression, mainly they are depends on (i) without PCR efficiency correction (Pfaffl et al., 2001) (ii) with PCR efficiency correction (Tichopad et al., 2003).

Where E= qRT PCR efficiency, Ref= internal control gene, Target= target gene, Ct = Cycle threshold value and = Change in Ct value of target gene with respect to internal control gene
Applications of qRT-PCR:
qRT-PCR can be applied to traditional PCR applications as well as new applications that would have been less effective with traditional PCR. With the ability to collect data in the exponential growth phase, the power of PCR has been expanded into applications such as: Viral Quantitation, Quantitation of Gene Expression, Array Verification, Drug Therapy Efficacy, DNA Damage measurement, Quality Control and Assay Validation, Pathogen detection and Genotyping.
Related Topics