Chapter: Clinical Anesthesiology: Clinical Pharmacology: Pharmacological Principles
Pharmacodynamics

PHARMACODYNAMICS
Pharmacodynamics, the study of how drugs
affect the body, involves the concepts of potency, efficacy, and therapeutic
window. Pharmacokinetic mod-els can range from entirely empirical dose versus
response relationships to mechanistic models of ligand–receptor binding. The
fundamental pharma-codynamic concepts are captured in the relation-ship between
exposure to a drug and physiological response to the drug, often called the dose–response or concentration–response relationship.
Exposure–Response Relationships
As the body is exposed to an increasing
amount of a drug, the response to the drug similarly increases, typically up to
a maximal value. This fundamental concept in the exposure versus response
relationship is captured graphically by plotting exposure (usually dose or
concentration) on the x axis as the
indepen-dent variable, and the body’s response on the y axis as the dependent variable. Depending on the cir-cumstances,
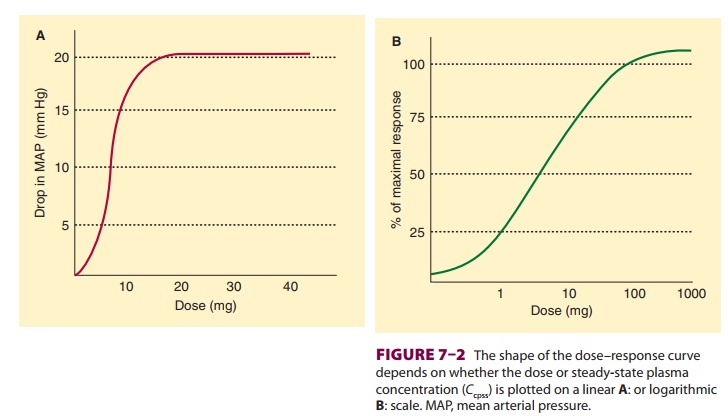
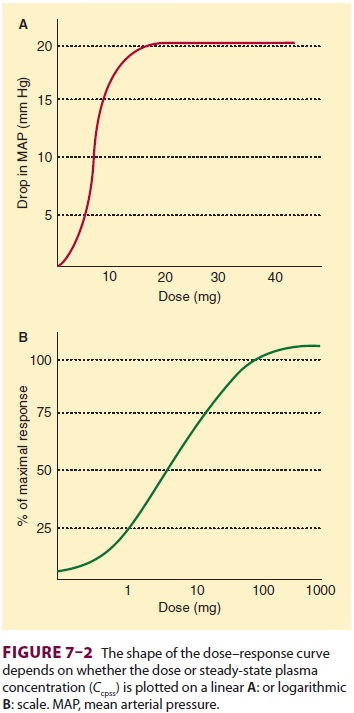
the dose or concentration may be plot-ted on a linear scale (Figure 7–2A)
or a logarithmic
scale ( Figure 7–2B), while the response
is typi-cally plotted either as the actual measured response (Figure 7–2A) or
as a fraction of the baseline or max-imum physiological measurement (Figure
7–2B). For our purposes here, basic pharmacodynamic properties are described in
terms of concentration, but any metric of drug exposure (dose, area under the
curve, etc) could be used.
The shape of the relationship is
typically sig-moidal, as shown in Figure 7–2. The sigmoidal

shape reflects the observation that
often a certain amount of drug must be present before there is any measurable
physiological response. Thus, the left side of the curve is flat until the drug
concentration reaches a minimum threshold. The right side is also flat,
reflecting the maximum physiological response of
the body, beyond which the body simply cannot respond to additional drug (with
the possible excep-tion of eating and weight). Thus, the curve is flat on both
the left and right sides. A sigmoidal curve is required to connect the baseline
to the asymptote, which is why sigmoidal curves are ubiquitous when modeling
pharmacodynamics
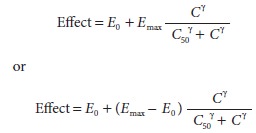
The
sigmoidal relationship between exposure and response is defined by one of two
interchange-able relationships:

In
both cases, E0 is the
baseline effect in the absence of drug, C
is drug concentration, C50
is the concentration associated with half-maximal effect, and γ
describes the steepness of the concentration ver-sus response relationship. For
the first equation, Emax
is the maximum change from baseline. In the second equation, Emax is the maximum
physiological mea-surement, not the maximum change from baseline.
Once
defined in this fashion, each parameter of the pharmacodynamic model speaks to
the spe-cific concepts mentioned earlier. Emax
is related to the intrinsic efficacy of a drug. Highly efficacious drugs have a
large maximum physiological effect, characterized by a large Emax. For drugs that lack
efficacy, Emax will equal E0. C50 is a measure of drug potency. Highly potent drugs
have a low C50; thus small
amounts produce the drug effect. Drugs lack-ing potency have a high C50,
indicating that a large amount of drug is required to achieve the drug effect.
The parameter γ indicates steepness of the
relationship between concentration and effect. A γ
value less than 1 indicates a very gradual increase in drug effect with
increasing concentration. A value greater than 4 suggests that once drug effect
is observed, small increases in drug concentration produce large increases in
drug effect until the maxi-mum effect is reached.
The
curve described above represents the rela-tionship of drug concentration to a
continuous physiological response. The same relationship can be used to
characterize the probability of a binary (yes/no) response to a drug dose:

In
this case, the probability (P) ranges
from 0 (no chance) to 1 (certainty). P0
is the probability of a “yes” response in the absence of drug. Pmax is the maximum
probability, necessarily less than or equal to 1. As before, C is the concentration, C50 is the concentration
associated with half-maximal effect, and γ
describes the steepness of the concentration versus response relationship.
Half-maximal effect is the same as 50% probability of a response when P0 is 0 and Pmax is 1.
The
therapeutic window for a drug is the
range between the concentration associated with a desired therapeutic effect
and the concentration associated with a toxic drug response. This range can be
mea-sured either between two different points on the same concentration versus
response curve, or the distance between two distinct curves. For a drug such as
sodium nitroprusside, a single concentra-tion versus response curve defines the
relationship between concentration and decrease in blood pres-sure. The
therapeutic window might be the differ-ence in the concentration producing a
desired 20% decrease in blood pressure and a toxic concentration that produces
a 60% decrease in blood pressure. However, for a drug such as lidocaine, the
thera-peutic window might be the difference between the C50for local anesthesia and the C50for lidocaine-induced seizures, the latter being a
separate concen-tration versus response relationship. The therapeutic index is
the C50 for toxicity
divided by the C50 for the
desired therapeutic effect. Because of the risk of ventilatory and
cardiovascular depression (even at concentrations only slightly greater than
those pro-ducing anesthesia), most inhaled and intravenous hypnotics are
considered to have very low therapeu-tic indices relative to other drugs.
Drug Receptors
Drug receptors are
macromolecules, typically pro-teins, that bind a drug (agonist) and mediate the
drug response. Pharmacological antagonists reverse the effects of the agonist
but do not otherwise exert an effect of their own. Competitive antagonism
occurs when the antagonist competes with the agonist for the binding site, each
potentially displacing the other. Noncompetitive antagonism occurs when the
antag-onist, through covalent binding or another process, permanently impairs
the drug’s access to the receptor.
The
drug effect is governed by the fraction of receptors that are occupied by an
agonist. That frac-tion is based on the concentration of the drug, the
concentration of the receptor, and the strength of binding between the drug and
the receptor. This binding is described by the law of mass action, which states
that the reaction rate is proportional to the concentrations of the reactants:

where
[D] is the concentration of the drug,
[ RU] is the concentration of unbound
receptor, and [DR] is the
concentration of bound receptor. The rate con-stant kon defines the rate of ligand binding to the receptor.
The rate constant koff
defines the rate of ligand unbiom the receptor. According to the law of mass
action, the rate of receptor binding, d[DR]/dt
is:nding fr

Steady
state occurs almost instantly. Because the rate of formation at steady state is
0, it follows that:

In
this equation, kd is the
dissociation rate con-stant, defined as kon/koff. If we define f, fractional receptor occupancy, as:

then
we can solve for receptor occupancy as:

The
receptors are half occupied when [ D]
=kd.
Thus, kd is the
concentration of drug associated with 50% receptor occupancy.
Receptor
occupancy is only the first step in mediating drug effect. Binding of the drug
to the receptor can trigger a myriad of subsequent steps, including opening or
closing of an ion channel, activation of a G protein, activation of an
intracel-lular kinase, direct interaction with a cellular struc-ture, or direct
binding to DNA.
Like
the concentration versus response curve, the shape of the curve relating
fractional receptor occupancy to drug concentration is intrinsically sigmoidal.
However, the concentration associated with 50% receptor occupancy and the
concentra-tion associated with 50% of maximal drug effect are not necessarily
the same. Maximal drug effect could occur at very low receptor occupancy, or
(for partial agonists) at greater than 100% receptor occupancy.
Prolonged
binding and activation of a receptor by an agonist may lead to hyporeactivity
(“desensi-tization”) and tolerance. If the binding of an endog-enous ligand is
chronically blocked, then receptors may proliferate resulting in
hyperreactivity and increased sensitivity.
Related Topics