Chapter: Psychology: Treatment of Mental Disorders
Meta-Analyses of Therapy Outcome - Treatment of Mental Disorders
Meta-Analyses of Therapy Outcome
It
seems, then, that our efforts to evaluate therapies will need to draw on
diverse lines of evidence from many different studies. This creates a new
question for us: How should we put together the evidence? What is the best way
to integrate and summarize the available data? For many investigators, the
answer lies in a statistical technique called meta-analysis.
In
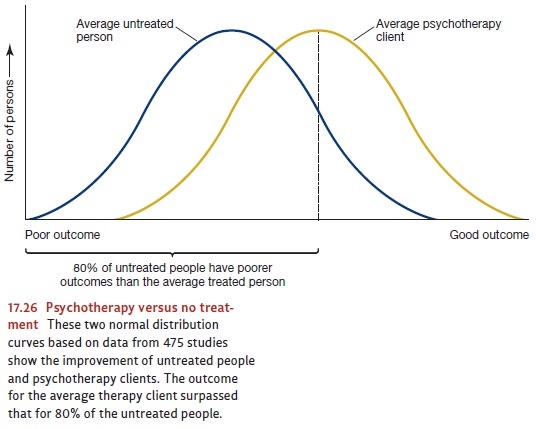
one of the earliest analyses of this kind, 475 studies comprising 25,000
patients were reviewed (M. L. Smith et al., 1980; Figure 17.26). In each of
these studies, patients who received some kind of psychotherapy were compared
with a similar group of

patients
who did not receive any. The studies included in this analysis differed in many
respects. One was the kind of psychotherapy used—whether psychodynamic,
human-istic, behavioral, or cognitive. Another factor that varied was the
criterion of improve-ment. In some cases, it was the level of a symptom: the
amount of avoidance that a person with snake phobias eventually showed toward
snakes, the number of washing episodes shown by a patient who washed
compulsively, and so on. In others, it was based on an improvement in
functioning, such as a rise in the grade-point average (GPA) of a student who
was disturbed. In still others, such as studies of patients with depression, it
was an improvement in mood as rated by scales completed by the patient himself
or by knowledgeable outsiders, such as his spouse and children.
Given
all these differences among the studies, combining the results seems
problem-atic, but meta-analysis provides a method. Consider two hypothetical
studies, A and B. Let us say that Study A shows that, after treatment, the
average patient with snake pho-bia can move closer to a snake than the average
patient who received no treatment. Let us also assume that Study B found that
students with depression who received psychotherapy show a greater increase in
GPA than do equivalent students in an untreated control group. On the face of
it, there is no way to average the results of the two studies because they use
completely different units. In the first case, the average effect of
therapy—that is, the difference between the group that received treatment and
the one that did not—is measured in feet (how near the snake the patient will
go); in the second, it is counted in GPA points. But here is the trick provided
by meta-analysis. Let us suppose we find that in Study A, 85% of the treated
patients are able to move closer to the snake than the average untreated
patient. Let us further suppose that in Study B, 75% of the students who
received psychotherapy earn a GPA higher than the average GPA of the untreated
students. Now we can average the scores. To be sure, dis-tance and GPA points
are like apples and oranges and cannot be compared. But the percentage
relationships—in our case, 85 and 75—are comparable. Since this is so, they can
be averaged across different studies.
What,
therefore, do we learn from meta-analyses? The conclusion drawn by averag-ing
across the 475 studies was that the “average person who receives therapy is
better off at the end of it than 80% of the persons who do not”. Later
meta-analyses have used different criteria in selecting studies for inclusion
but yield similar results (see, for example, Wampold et al., 1997). Other
studies found that even months or years after treatment, patients still show
these improvements (Nicholson & Berman, 1983).
Related Topics