Chapter: Aquaculture Engineering : Heating and Cooling
Log pressureŌĆōenthalpy (p-H) in heat pump

Log
pressureŌĆōenthalpy (p-H)
The heat pump process is often illustrated in a log
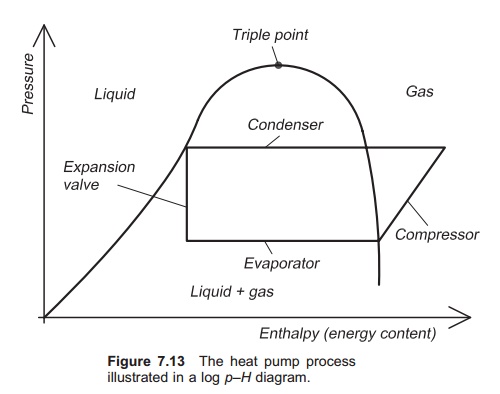
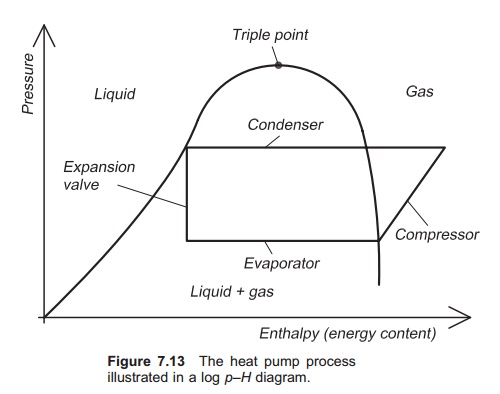
pressure (p)ŌĆōenthalpy (H) diagram (log pŌĆōH diagram) (Fig. 7.13). Enthalpy is a parameter that is a measure
of the energy content of refrigerant; units are kJ/kg. The log pŌĆōH
diagram illustrates clearly the changes of phase in the refrigerant. The
pressure of the refrigerant is constant through the evaporator, but its energy
content (H) increases because it
gradually changes phase from liquid to gas and in doing so takes up energy from
its surroundings. When the refrigerant enters the compressor it is in the gas
phase. Electric energy is supplied to the compressor, most of which is
transferred to the refrigerant, so further increasing its enthalpy. In the
compressor the pressure of the gas increases and it is then fed into the
condenser. Here energy is released because the gas changes phase to liquid and
the enthalpy drops, but the pressure remains stable: all the energy that was
stored when the liquid changed phase into gas is now released. The refrigerant
exits the condenser as liquid and then enters the expansion valve where its
pressure drops, but no energy is removed or added (assum-ing ideal conditions).
Therefore the enthalpy is the same, as shown by a vertical line.
The pŌĆōH diagram is specific for each medium,
and shows the phase of the medium in relation to its pressure and enthalpy
content. It is also known as a nose diagram, depending on the presentation. On
one side of the ŌĆśnoseŌĆÖ the phase of the working medium is liquid; on the other
side it is gas, and in between both gas and liquid. The heat pump processes
therefore happen inside the ŌĆśnoseŌĆÖ, because it is here that the phase transfers
occur.

Related Topics