Chapter: Pharmaceutical Biotechnology: Fundamentals and Applications : Pharmacokinetics and Pharmacodynamics of Peptide and Protein Drugs
Indirect Link PK/PD Models - Pharmacodynamics of Protein Therapeutics
Indirect Link PK/PD Models
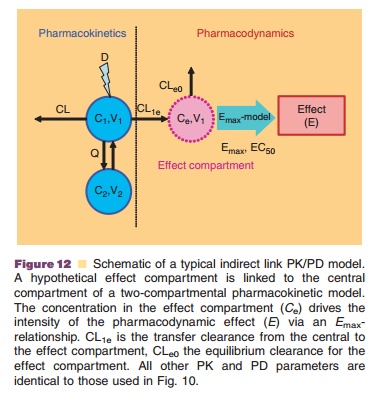
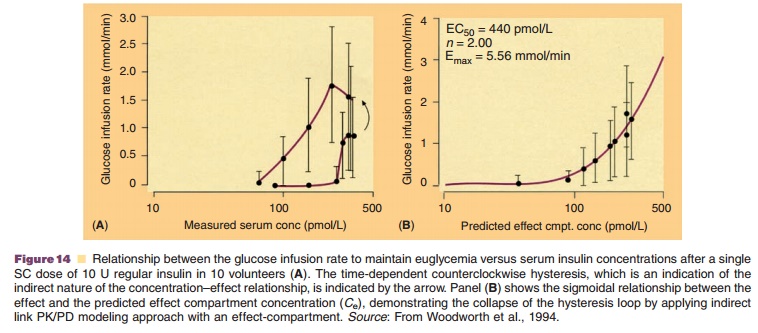
The concentration–effect relationship of many protein drugs, however, cannot be described by direct link PK/PD models, but is characterized by a temporal dissociation between the time courses of plasma concentration and effect. In this case, plasma concen-tration maxima occur before effect maxima, effect intensity may increase despite decreasing plasma concentrations and may persist beyond the time drug concentrations in plasma are no longer detectable. The relationship between measured concentration and observed effect follows a counter-clockwise hysteresis loop. This phenomenon can either be caused by an indirect response mechanism (see next section) or by a distributional delay between the drug concentrations in plasma and at the effect site.

The latter one can conceptually be described by an indirect link model,
which attaches a hypothetical effect-compartment to a pharmacokinetic
compart-ment model (Fig. 12). The effect compartment addition to the
pharmacokinetic model does not account for mass balance, i.e., no actual mass
transfer is implemented in the pharmacokinetic part of the PK/PD model.
Instead, drug transfer with respect to the effect compartment is defined by the
time course of the effect itself (Sheiner et al., 1979; Holford and Sheiner,
1982). The effect-compartment approach, however, is necessary, as the effect
site can be viewed as a small part of a pharmacokinetic compartment that from a
pharmacokinetic point of view cannot be distinguished from other tissues within
that compartment. The concentration in the effect compartment represents the
active drug con-centration at the effect site that is slowly equilibrat-ing
with the plasma, and is usually linked to the effect via an Emax model.
Although this PK/PD model is constructed with tissue distribution as the
reason for the delay of the effect, the distribution clearance to the effect
compart-ment can be interpreted differently, including other reasons of delay,
such as transduction processes and secondary post receptor events.

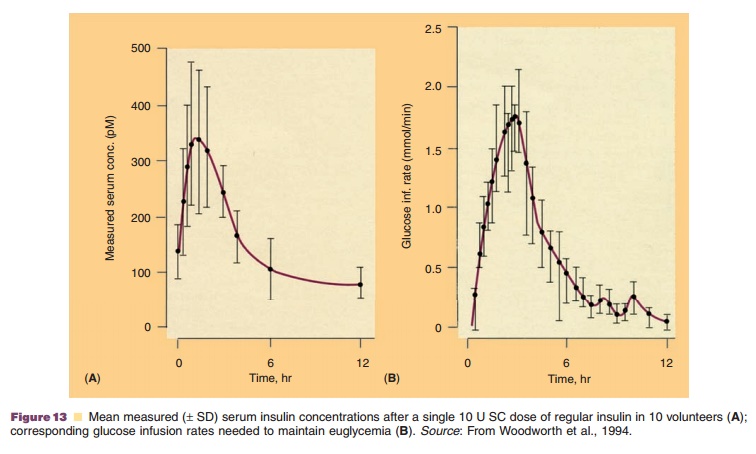
The hypoglycemic effect of insulin has been modeled by this type of PK/PD model (Hooper, 1991; Woodworth et al., 1994). Figure 13 shows the mean serum concentration profile of insulin after a single SC injection of 10 U in 10 volunteers, and the correspond-ing effect measured as the glucose infusion rate to maintain an euglycemic state. Figure 14 shows the hysteresis in the concentration–effect relationship, and how a typical sigmoidal concentration–effect curve is obtained with the hypothetical effect con-centration using a one-compartment pharmacokinetic model with indirect link (Woodworth et al., 1994).

Related Topics