Chapter: Pharmaceutical Biotechnology: Fundamentals and Applications : Pharmacokinetics and Pharmacodynamics of Peptide and Protein Drugs
Cell Life Span Models - Pharmacodynamics of Protein Therapeutics
Cell Life Span Models
A sizable number of protein therapeutics exerts its pharmacologic effect
through direct or indirect modulation of blood and/or immune cell types.

For these kinds of therapeutics, cell life span models have been proven
useful to capture their exposure-response relationship and describe and predict
drug effects (Perez-Ruixo et al., 2005). Cell life span models are
mechanism-based, physiologic PK/PD models that are established based on the
sequential maturation and lifespan-driven cell turnover of theiraffected cell
types and progenitor cell populations. Cell life span model are especially
widely used for characterizing the dose–concentration–effect relation-ships of
hematopoietic growth factors aimed at modifying erythropoiesis, granulopoiesis,
or throm-bopoiesis (Perez-Ruixo et al., 2005; Agoram et al., 2006). The fixed
physiologic time span for the maturation of precursor cells is the major reason
for the prolonged delay between drug administration and the observed response,
i.e., change in the cell count in peripheral blood. Cell life span models
accommodate this sequential maturation of several precursor cell populations at
fixed physiologic time intervals by a series of transit compartments linked via
first- or zero-order processes with a common transfer rate constant.

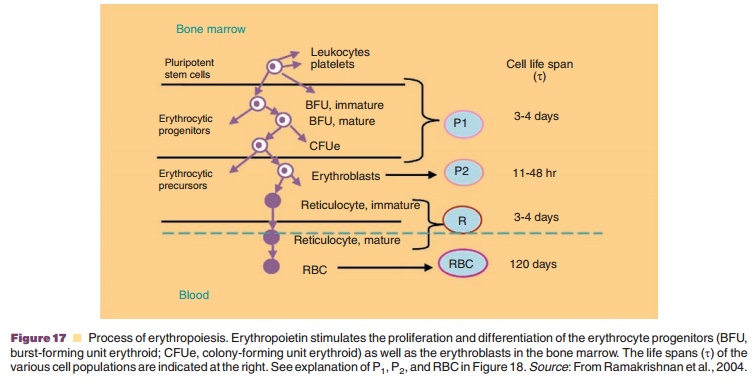
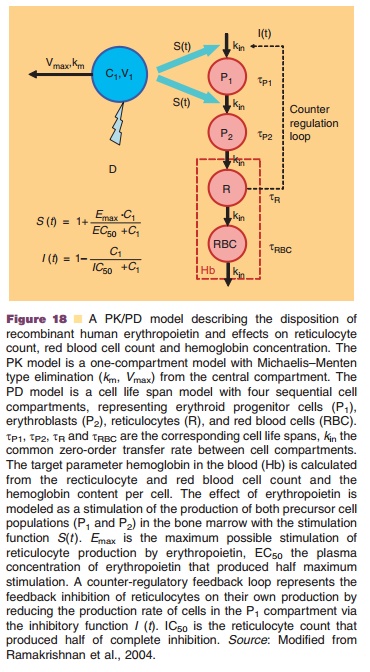
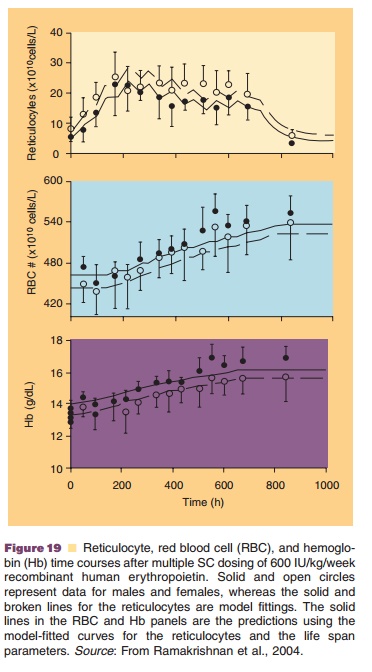
A cell life span model was for example used to describe the effect of a multiple dose regimen of recombinant human erythropoietin (rhEPO) 600 IU/ kg given once weekly by SC injection (Ramakrishnan et al., 2004). The process of erythropoiesis and the applied PK/PD approach including a cell life span model are depicted in Figures 17 and 18, respectively. rhEPO is known to stimulate the production and release of reticulocytes from the bone marrow. The rhEPO effect was modeled as stimulation of the maturation of two progenitor cell populations (P1 and P2 in Fig. 17), including also a feedback inhibition between erythrocyte count and progenitor prolifera-tion. Development and turn-over of the subsequent populations of reticulocytes and erythrocytes was modeled taking into account their life spans as listed in Figure 17. The hemoglobin concentration as pharmacodynamic target parameter was calculated from erythrocyte and reticulocyte counts and hemo-globin content per cell. Figure 19 shows the resulting times courses in reticulocyte count, erythrocyte count and hemoglobin concentration.

Related Topics