Applications of Differentiation maxima and minima - Economic Order Quantity(EOQ) | 11th Business Mathematics and Statistics(EMS) : Chapter 6 : Applications of Differentiation
Chapter: 11th Business Mathematics and Statistics(EMS) : Chapter 6 : Applications of Differentiation
Economic Order Quantity(EOQ)
Economic Order Quantity(EOQ):
Economic order quantity is that
size of order which minimizes total annual cost of carrying inventory and the
cost of ordering under the assumed conditions of certainty with the annual
demands known. Economic order quantity (EOQ) is also called Economic lot size
formula.
NOTE
The derivation of
this formula is given for better understanding and is exempted from
examination.
The formula is to determine the
optimum quantity ordered (or produced) and the optimum interval between
successive orders, if the demand is known and uniform with no shortages.
Let us have the following
assumptions.
(i) Let R be the uniform demand per unit time.
(ii) Supply
or production of items to the inventory is instantaneous.
(iii) Holding
cost is â‚ą C1 per unit time.
(iv) Let
there be 'n' orders (cycles) per
year, each time 'q' units are ordered
(produced).
(v) Let â‚ą C3 be the ordering (set up) cost per order (cycle). Let
't' be the time taken between each
order.
Diagrammatic representation of
this model is given below:
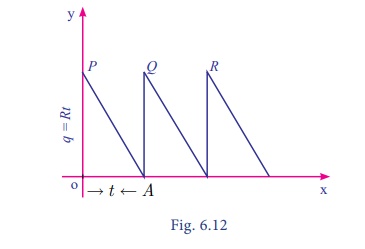
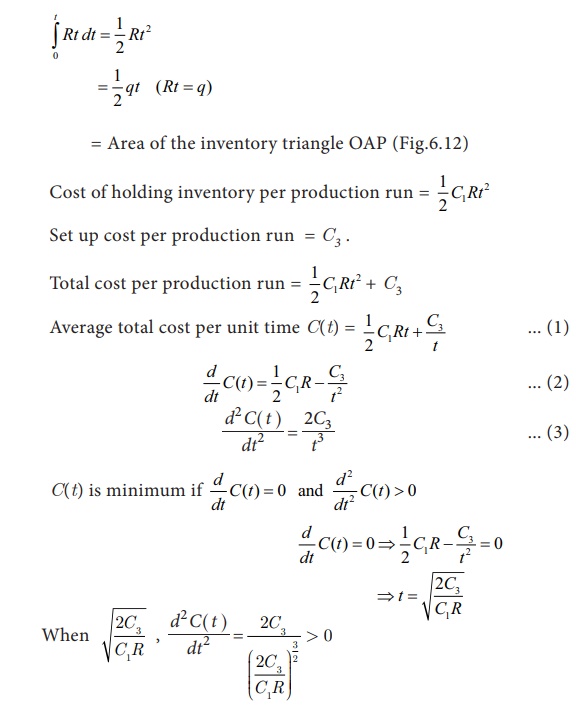
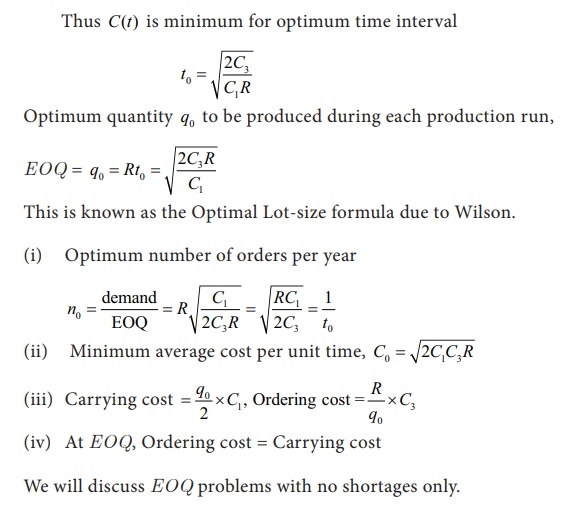
If a production run is made at
intervals t, a quantity q = Rt must be produced in each run. Since
the stock in small time dt is Rt dt , the stock in period t is
Example 6.30
A company uses 48000 units of a
raw material costing â‚ą 2.5 per
unit. Placing each order costs â‚ą45 and
the carrying cost is 10.8 % per year of the average inventory. Find the EOQ, total number of orders per year and
time between each order. Also verify that at
EOQ carrying cost is equal to ordering cost.
Solution:
Here demand rate R = 48000
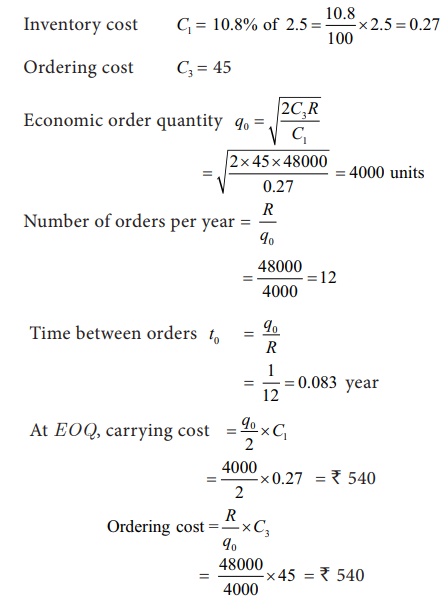
So at EOQ carrying cost is equal to ordering cost.
Example 6.31
A manufacturer has to supply
12,000 units of a product per year to his customer. The ordering cost (C3) is â‚ą
100 per
order and carrying cost is â‚ą 0.80 per
item per month. Assuming there is no shortage cost and the replacement is
instantaneous, determine the
(i) economic
order quantity
(ii) time
between orders
(iii) number of orders per year
Solution:
Demand per year : R = 12,000 units
Ordering cost: C3= â‚ą 100/order
Carrying cost : C1= 0.80/item/month
= 0.80Ă—12 per year
= â‚ą 9.6 per year
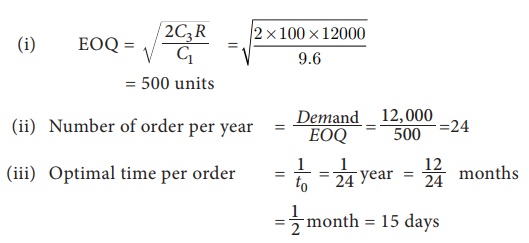
Example 6.32
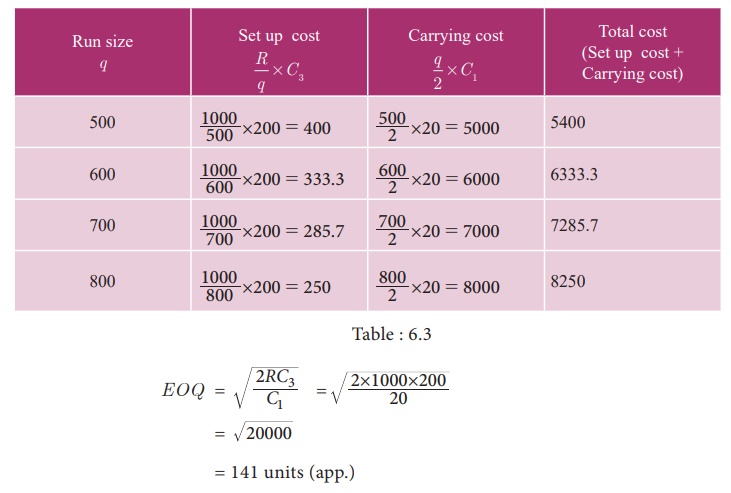
A company has to supply 1000 item
per month at a uniform rate and for each time, a production run is started with
the cost of â‚ą 200.
Cost of holding is â‚ą 20 per
item per month. The number of items to be produced per run has to be
ascertained. Determine the total of setup cost and average inventory cost if
the run size is 500, 600, 700, 800. Find the optimal production run size using EOQ formula.
Solution:
Demand : R = 1000 per month
Setup cost : C3 = â‚ą 200 per
order
Carrying cost: C1= â‚ą 20 per item per month.
Example 6.33
A manufacturing company has a contract to supply 4000 units of an item per year at uniform rate. The storage cost per unit per year amounts to â‚ą 50 and the set up cost per production run is â‚ą 160. If the production run can be started instantaneously and shortages are not permitted, determine the number of units which should be produced per run to minimize the total cost.
Solution :
Annual demand : R = 4000
Storage cost: C1 = â‚ą 50
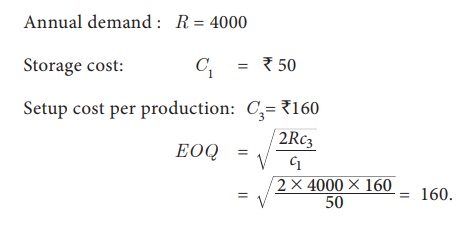
To minimize the production cost
number of units produced per run is 160 units.
Example 6.34
A company buys in lots of 500
boxes which is a 3 month supply. The cost per box is â‚ą125 and the ordering cost in â‚ą150. The inventory carrying cost
is estimated at 20% of unit value.
(i) Determine the total amount
cost of existing inventory policy
(ii) How much money could be
saved by applying the economic order quantity?
Solution:
Given
Ordering cost per order : C3 = â‚ą150 per order.
Number of units per order: q= 500 units
Annual demand = 500 Ă— 4 = 2000
units
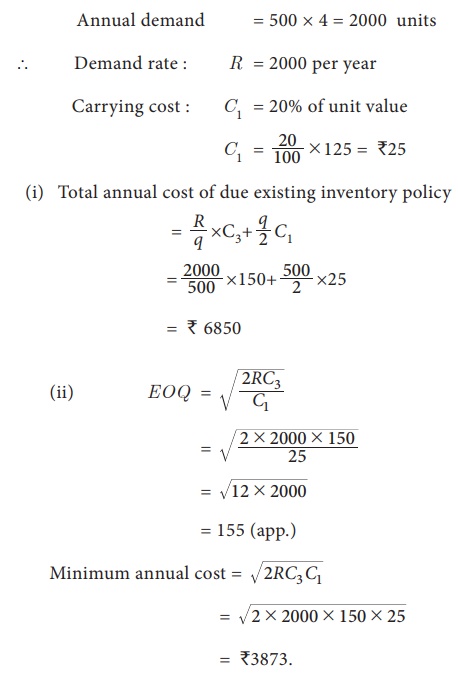
By applying the economic order
quantity, money saved by a company = 6850–3873
= â‚ą2977.
Exercise 6.3
1. The following table gives the
annual demand and unit price of 3 items
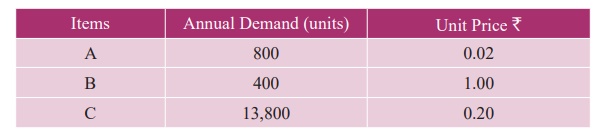
Ordering cost is Rs. 5 per order
and holding cost is 10% of unit price.
Determine the following:
(i) EOQ in units
(ii) Minimum
average cost
(iii) EOQ in rupees
(iv) EOQ in years of supply
(v) Number of orders per year.
2. A dealer has to supply his
customer with 400 units of a product per every week. The dealer gets the
product from the manufacturer at a cost of â‚ą 50 per
unit. The cost of ordering from the manufacturers in â‚ą 75 per order. The cost of
holding inventory is 7.5 % per year of the product cost. Find (i) EOQ (ii)
Total optimum cost.
Related Topics