Applications of differentiation in business and economics - Demand, supply, cost, revenue and profit functions | 11th Business Mathematics and Statistics(EMS) : Chapter 6 : Applications of Differentiation
Chapter: 11th Business Mathematics and Statistics(EMS) : Chapter 6 : Applications of Differentiation
Demand, supply, cost, revenue and profit functions
Demand, supply, cost, revenue and
profit functions
Demand function
In a market, the quantity of a
commodity demanded by the consumer depends on its price. If the price of the
commodity increases, then the demand decreases and if the price of the
commodity decreases, then the demand increases.
The relationship between the
quantity and the unit price of a commodity demanded by consumer is called as demand function
and is defined as x = f ( p) or p = f (x)
, where x>0 and p>0 .
Graph of the demand function, x
= f(p)
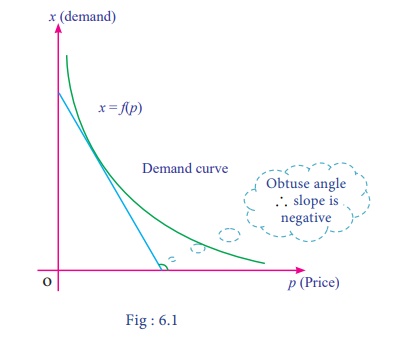
Observations
(i) Price
and quantity of the demand function are in inverse variation.
(ii) The
graph of the demand function lies only in first quadrant.
(iii) Angle
made by any tangent to the demand curve with respect to the positive direction
of x ŌĆō axis is always an obtuse
angle.
(iv) Slope of the demand curve is
negative( ŌĆōve).
Supply function
In a market, the quantity of a
commodity supplied by producer depends on its price. If the price of the
commodity increases, then quantity of supply increases and if the price of the
commodity decreases, then quantity of supply decreases.
The relationship between the
quantity and the unit price of a commodity supplied by producer is called as supply function
and is defined as x = g(p)
or p=g(x) where x > 0 and p > 0
The graph of the supply function, x= g(p)
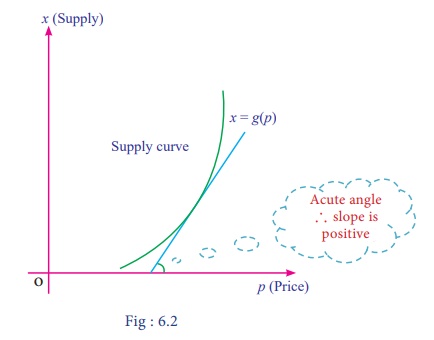
Observations
(i) Price
and quantity of the supply function are in direct variation.
(ii) The
graph of supply function lies only in first quadrant.
(iii) Angle
made by any tangent to the supply curve with respect to positive direction of x ŌĆō axis is always an acute angle.
(iv) Slope of the supply curve is
positive (+ve).
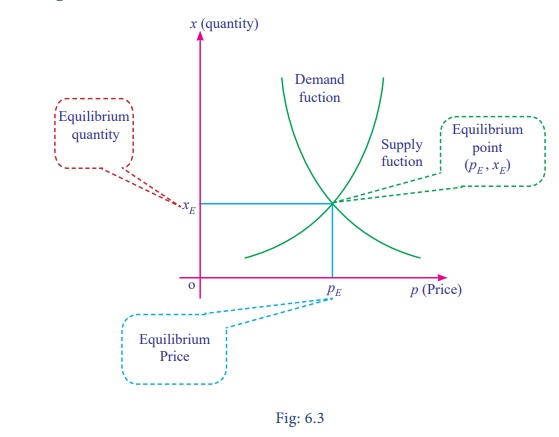
Equilibrium Price
The price at which the demand for
a commodity is equal to its supply is called as Equilibrium Price and is
denoted by pE.
Equilibrium Quantity
The quantity at which the demand
for a commodity is equal to its supply is called as Equilibrium Quantity and is
denoted by xE.
NOTE
Usually the demand
and supply functions are expressed as x
in terms of p, so the equilibrium
quantity is obtained either from the demand function (or) from the supply
function by substituting the equilibrium price.
Equilibrium Point
The point of intersection of the
demand and supply function (pE,
xE) is called as
equilibrium point.
Diagrammatical explanation of equilibrium price, equilibrium quantity and equilibrium point
Average and Marginal concepts
Usually, the variation in the
dependent quantity ŌĆśyŌĆÖ with respect
to the independent quantity ŌĆśxŌĆÖ can
be described in terms of two concepts namely
(i) Average concept and
(ii) Marginal concept.
(i) Average concept
The average concept expressed as
the variation of y over a whole range
of x and is denoted by y/x .
(ii) Marginal concept
The marginal concept expressed as
the instantaneous rate of change of y
with respect to x and is denoted by dy/dx .
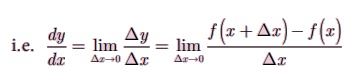
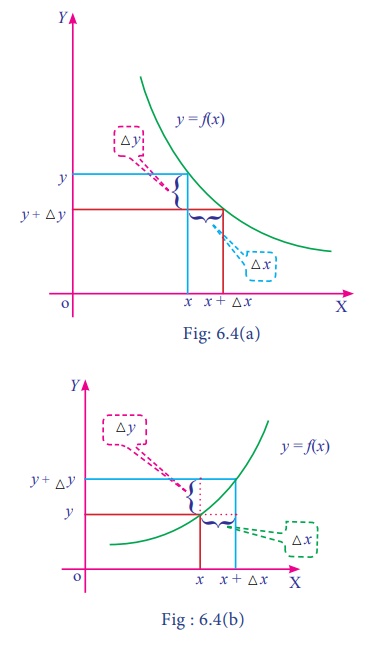
Remark:
If Ōłåx be the small change in x
and Ōłåy be the corresponding change in
y of the function y=f(x), then
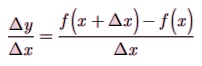
Instantaneous rate of change of y with respect to x is defined as the limiting case of ratio of the change in y to the change in x.
Cost function
The amount spent for the
production of a commodity is called its cost function.
Normally, total cost function [TC] consists of two parts.
(i) Variable cost
(ii) Fixed cost
Variable cost
Variable cost is the cost which
varies almost in direct proportion to the volume of production.
Fixed cost
Fixed cost is the cost which does
not vary directly with the volume of production.
If f(x) be the variable cost
and k be the fixed cost for
production of x units, then total
cost is C(x) = f(x) + k,
x>0.
NOTE
(i) Variable cost f(x) is a single valued function.
(ii) Fixed cost k is
independent of the level of output.
(iii) f(x) does not contain constant term.
Some standard results
If C(x) = f(x)
+ k be the total cost function, then
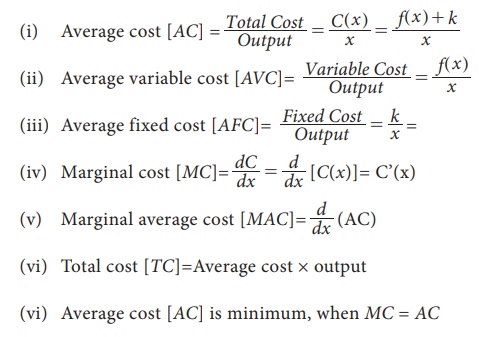
(vi) Total cost [TC]=Average cost ├Ś output
(vii) Average cost [AC] is minimum, when MC =
AC
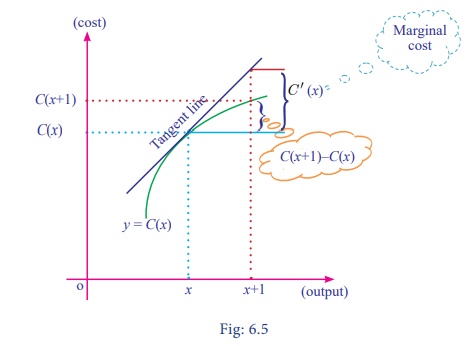
Remark:
The marginal cost [MC] is approximately equal to the
additional production cost of (x+1)th
unit, when the production level is x
units.
Diagrammatical explanation of marginal cost [MC]
Marginal cost is the change in
aggregate cost when the volume of production is increased or decreased by one
unit.
Revenue function
Revenue is the amount realised on
a commodity when it is produced and sold. If x is the number of units produced and sold and p is its unit price, then the total revenue function R(x)
is defined as R(x) =px, where x and p are positive.
Some standard results
If R(x) =px be the revenue function, then
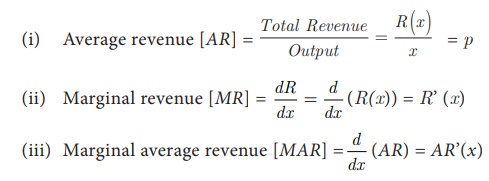
Remarks:
(i) Average revenue
[AR] and price [p] are the same. [i.e. AR=p]
(ii) The marginal
revenue [MR] is approximately equal
to the additional revenue made on selling of (x+1)th unit, whenx
the sales level is x units.
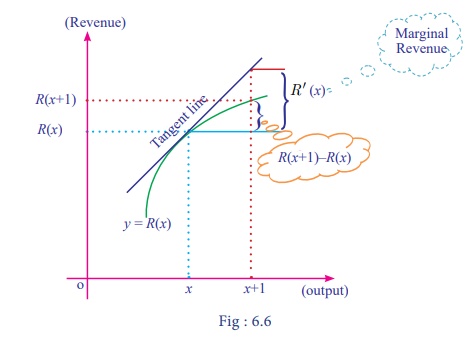
Diagrammatical explanation of Marginal Revenue [MR]
Marginal revenue is the change in
aggregate revenue when the volume of selling unit is increased by one unit.
Profit function
The excess of total revenue over
the total cost of production is called the profit. If R(x) is the total revenue
and C(x) is the total cost, then profit function P(x) is defined as P(x) = R(x) ŌĆō C(x)
Some standard results
If P(x) = R(x) ŌĆō C(x) be the profit function, then
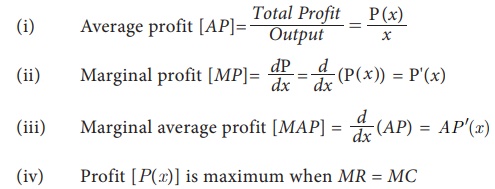
(iv) Profit [P(x)] is maximum when MR = MC
Related Topics