Statistical Inference - statistical hypothesis: Null Hypothesis and Alternative Hypothesis, Level of Significants, Type of Errors | 12th Business Maths and Statistics : Chapter 8 : Sampling Techniques and Statistical Inference
Chapter: 12th Business Maths and Statistics : Chapter 8 : Sampling Techniques and Statistical Inference
statistical hypothesis: Null Hypothesis and Alternative Hypothesis, Level of Significants, Type of Errors
Meaning : Null
Hypothesis and Alternative Hypothesis - Level of Significants and Type of
Errors
Statistical Hypothesis
Statistical hypothesis
is some assumption or statement, which may or may not be true, about a
population.
There are two types of
statistical hypothesis
(i) Null hypothesis
(ii) Alternative hypothesis
Null Hypothesis
Definition 8.7
According to Prof.
R.A.Fisher, “Null hypothesis is the hypothesis which is tested for possible
rejection under the assumption that it is true”, and it is denoted by H0
.
For example: If we
want to find the population mean has a specified value μ0 , then the null
hypothesis H0 is set as follows H0 : μ = μ0
Alternative Hypothesis
Any hypothesis which is
complementary to the null hypothesis is called as the alternative hypothesis
and is usually denoted by H1 .
For example: If we want
to test the null hypothesis that the population has specified mean μ i.e., H0
: μ = μ 0 then the alternative
hypothesis could be any one among the following:
i.
H1 : μ ≠ μ 0 (μ > or μ < μ 0)
ii.
H1 : μ > μ 0
iii. H1 : μ < μ 0
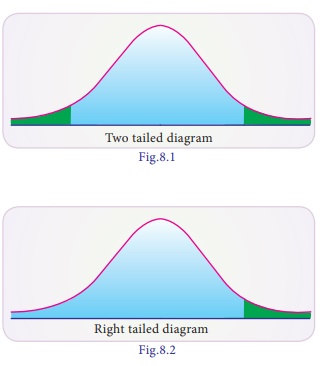
The alternative
hypothesis in H1 : μ ≠ μ 0 is known as two tailed
alternative test. Two tailed test is one where the hypothesis about the
population parameter is rejected for the value of sample statistic falling into
either tails of the sampling distribution. When the hypothesis about the
population parameter is rejected only for the value of sample statistic falling
into one of the tails of the sampling distribution, then it is known as
one-tailed test. Here H1 : μ > μ 0 and H1 : μ < μ0 are known as one tailed alternative.
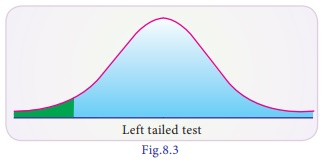
Right tailed test: H1 : μ > μ 0 is said to be right tailed test where the rejection region or critical region lies entirely on the right tail of the normal curve.
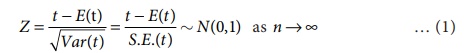
Left tailed test: H1 : μ < μ 0 is said to be left tailed test where the critical region lies entirely on the left tail of the normal curve. (diagram)
Types of Errors in Hypothesis testing
There is every chance
that a decision regarding a null hypothesis may be correct or may not be
correct. There are two types of errors. They are
Type I error: The error
of rejecting H0 when it is true.
Type II error: The error
of accepting when H0 it is false.
Critical region or Rejection region
A region corresponding
to a test statistic in the sample space which tends to rejection of H0
is called critical region or region of rejection.
Level of significance
The probability of type
I error is known as level of significance and it is denoted by . The level of
significance is usually employed in testing of hypothesis are 5% and 1%. The
level of significance is always fixed in advance before collecting the sample
information.
Critical values or significant values
The value of test
statistic which separates the critical (or rejection) region and the acceptance
region is called the critical value or significant value. It depend upon
(i) The level of
significance
(ii) The alternative
hypothesis whether it is two-tailed or single tailed.
For large samples, the
standardized variable corresponding to the statistic viz.,
The value of Z
given by (1) under the null hypothesis is known as test statistic. The critical
values of Z at commonly used level of significance for both two tailed
and single tailed tests are given in the normal probability table (Refer the
normal probably Table).
Since for large n,
almost all the distributions namely, Binomial, Poisson, etc., can be
approximated very closely by a normal probability curve, we use the normal test
of significance for large samples.
Related Topics