with Answer, Solution | Statistical Inference - Hypothesis Testing: Solved Example Problems | 12th Business Maths and Statistics : Chapter 8 : Sampling Techniques and Statistical Inference
Chapter: 12th Business Maths and Statistics : Chapter 8 : Sampling Techniques and Statistical Inference
Hypothesis Testing: Solved Example Problems
Example
8.14
An auto company decided
to introduce a new six cylinder car whose mean petrol consumption is claimed to
be lower than that of the existing auto engine. It was found that the mean
petrol consumption for the 50 cars was 10 km per litre with a standard deviation
of 3.5 km per litre. Test at 5% level of significance, whether the claim of the
new car petrol consumption is 9.5 km per litre on the average is acceptable.
Solution:
Sample size n =50 Sample
mean ![]() = 10 km Sample standard deviation s = 3.5 km
= 10 km Sample standard deviation s = 3.5 km
Population mean μ = 9.5
km
Since population SD is
unknown we consider σ = s
The sample is a large
sample and so we apply Z-test
Null Hypothesis: There
is no significant difference between the sample average and the company’s
claim, i.e., H0 : μ = 9.5
Alternative Hypothesis:
There is significant difference between the sample average and the company’s
claim, i.e., H1 : μ ≠ 9.5 (two tailed test)
The level of
significance α = 5% = 0.05
Applying the test
statistic
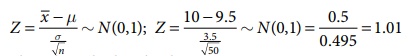
Thus the calculated
value 1.01 and the significant value or table value Zα/2 = 1.96
Comparing the calculated
and table value ,Here Z < Zα/2 i.e., 1.01<1.96.
Inference:Since the
calculated value is less than table value i.e., Z < Zα/2 at 5%
level of sinificance, the null hypothesis H0 is accepted. Hence we
conclude that the company’s claim that the new car petrol consumption is 9.5 km
per litre is acceptable.
Example
8.15
A manufacturer of ball
pens claims that a certain pen he manufactures has a mean writing life of 400
pages with a standard deviation of 20 pages. A purchasing agent selects a
sample of 100 pens and puts them for test. The mean writing life for the sample
was 390 pages. Should the purchasing agent reject the manufactures claim at 1%
level?
Solution:
Sample size n =100,
Sample mean ![]() = 390 pages, Population mean μ = 400 pages
= 390 pages, Population mean μ = 400 pages
Population SD σ = 20
pages
The sample is a large
sample and so we apply Z -test
Null Hypothesis: There
is no significant difference between the sample mean and the population mean of
writing life of pen he manufactures, i.e., H0 : μ = 400
Alternative Hypothesis:
There is significant difference between the sample mean and the population mean
of writing life of pen he manufactures, i.e., H1 : μ ≠ 400 (two
tailed test)
The level of
significance a = 1% = 0.01
Applying the test
statistic
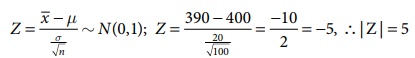
Thus the calculated
value |Z| = 5 and the significant value or table value Zα/2 = 2.58
Comparing the calculated
and table values, we found Z > Zα/2 i.e., 5 > 2.58
Inference: Since the
calculated value is greater than table value i.e., Z > Zα/2 at 1%
level of significance, the null hypothesis is rejected and Therefore we
concluded that μ ≠ 400 and the manufacturer’s claim is rejected at 1% level of
significance.
Example
8.16
(i) A sample of 900
members has a mean 3.4 cm and SD 2.61 cm. Is the sample taken from a large
population with mean 3.25 cm. and SD 2.62 cm?
(ii) If the
population is normal and its mean is unknown, find the 95% and 98% confidence
limits of true mean.
Solution:
(i) Given:
Sample size n = 900,
Sample mean ![]() = 3.4 cm, Sample SD σ = 2.61 cm
= 3.4 cm, Sample SD σ = 2.61 cm
Population mean μ= 3.25
cm, Population SD σ = 2.61 cm
Null Hypothesis H0
: μ = 3.25 cm (the sample has been drawn from the population mean
μ = 3.25 cm and SD σ =
2.61 cm)
Alternative Hypothesis H1
: μ ≠ 3.25 cm (two tail) i.e., the sample has not been drawn from the
population mean μ = 3.25 cm and SD σ = 2.61 cm.
The level of
significance α = 5% = 0.05
Teststatistic:
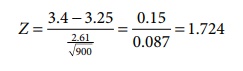
∴
Z = 1.724
Thus the calculated and
the significant value or table value Zα/2 = 1.96
Comparing the calculated
and table values, Z < Zα/2 i.e., 1.724 < 1.96
Inference:Since the
calculated value is less than table value i.e., Z > Zα/2 at 5%
level of significance, the null hypothesis is accepted. Hence we conclude that
the2 data doesn’t provide us any evidence against the null hypothesis.
Therefore, the sample has been drawn from the population mean μ = 3.25 cm and
SD, σ = 2.61 cm.
(ii) Confidence limits
95% confidential limits
for the population mean μ are :
![]() – Zα/2
SE ≤ µ ≤
– Zα/2
SE ≤ µ ≤ ![]() + Zα/2 SE
+ Zα/2 SE
3.4− (1.96× 0.087)≤ μ ≤
3.4+ (1.96× 0.087)
3.229≤ μ ≤ 3.571
98% confidential limits
for the population mean are :
![]() − Zα/2 SE ≤ µ ≤
− Zα/2 SE ≤ µ ≤ ![]() + Zα/2 SE
+ Zα/2 SE
3.4− (2.33× 0.087)≤ μ ≤
3.4+ (2.33× 0.087)
3.197 ≤ μ≤ 3.603
Therefore,95%
confidential limits is (3.229,3.571) and 98% confidential limits is
(3.197,3.603).
Example
8.17
The mean weekly sales of
soap bars in departmental stores were 146.3 bars per store. After an
advertising campaign the mean weekly sales in 400 stores for a typical week
increased to 153.7 and showed a standard deviation of 17.2. Was the advertising
campaign successful?
Solution:
Sample size n = 400
stores
Sample mean ![]() = 153.7 bars
= 153.7 bars
Sample SD s = 17.2 bars
Population mean μ =
146.3 bars
Since population SD is
unknown we can consider the sample SD s = σ
Null Hypothesis. The
advertising campaign is not successful i.e, H0 : μ = 146.3 (There is
no significant difference between the mean weekly sales of soap bars in
department stores before and after advertising campaign)
Alternative Hypothesis H1
: μ > 143.3 (Right tail test). The advertising campaign was successful
Level of significance a
= 0.05
Test statistic
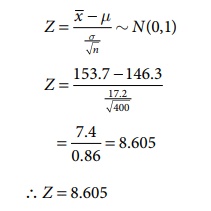
∴
Z = 8.605
Comparing the calculated
value Z = 8.605 and the significant value or table value Zα = 1.645 . we get
8.605 > 1.645
Inference: Since, the calculated value is much greater than table value i.e., Z > Zα , it is highly significant at 5% level of significance. Hence we reject the null hypothesis H0 and conclude that the advertising campaign was definitely successful in promoting sales.
Example
8.18
The wages of the factory
workers are assumed to be normally distributed with mean and variance 25. A
random sample of 50 workers gives the total wages equal to ₹ 2,550. Test the
hypothesis μ = 52, against the alternative hypothesis μ = 49 at 1% level of
significance.
Solution:
Sample size n = 50
workers
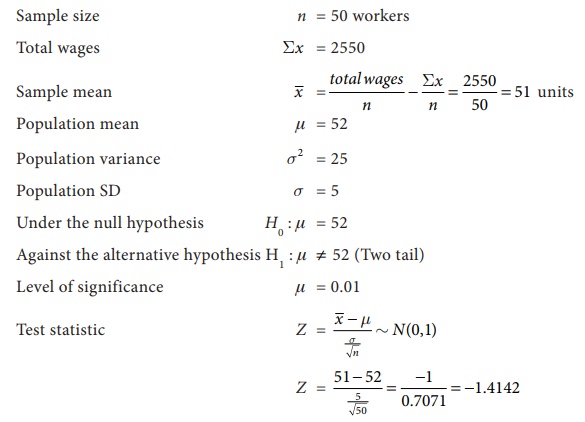
Since alternative
hypothesis is of two tailed test we can take | Z | = 1.4142
Critical value at 1%
level of significance is Zα/2 = 2.58
Inference: Since the calculated value is less than table value i.e., Z < Za at 1% level of significance, the null hypothesis H0 is accepted. Therefore, we conclude 2that there is no significant difference between the sample mean and population mean μ= 52 and SD σ = 5.
Example
8.19
An ambulance service
claims that it takes on the average 8.9 minutes to reach its destination in
emergency calls. To check on this claim, the agency which licenses ambulance
services has them timed on 50 emergency calls, getting a mean of 9.3 minutes
with a standard deviation of 1.6 minutes. What can they conclude at the level
of significance.
Solution:
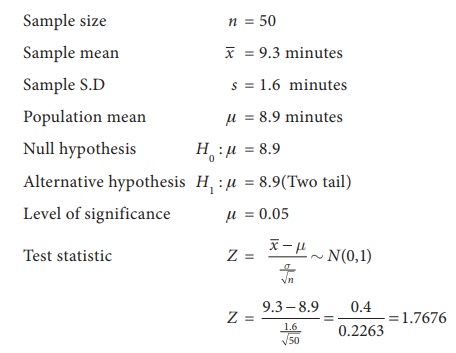
Calculated value Z = 1.7676
Critical value at 5% level of
significance is Zα/2 = 1.96
Inference: Since the calculated
value is less than table value i.e., Z < Zα/2 at 5% level of
significance, the null hypothesis is accepted. Therefore we conclude that an
ambulance service claims on the average 8.9 minutes to reach its destination in
emergency calls.
Related Topics