Chapter: Aquaculture Engineering : Water Transport
Pump performance curves and working point for centrifugal pumps
Pump performance curves and working point for centrifugal pumps
Characteristics curves
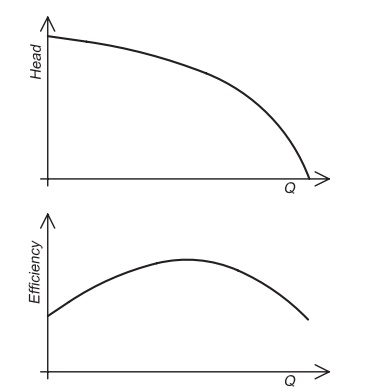
The characteristics curves (pump diagram) are used to describe the performance of centrifugal pumps (Fig. 2.16). The most important is the head versus capacity curve which shows the connection between the water flow (discharge) and the head. Depending on its construction the same centrifugal pump can either be used to deliver a large water flow with a low head or a smaller water flow with a larger head. Adding a valve on the pump outlet and gradually closing it will decrease the water flow but increase the head, because the cross-sectional area through which the water is forced is reduced. As the valve is closed more pressure is needed to discharge the water; again this increases the pump head. A pump characteristics curve can be constructed by measuring the water flow that the pump delivers with different heads: if pump behaviour is ideal, the plot should be a straight line. This seldom happens because of the reduction in pump efficiency at the limits of performance, so the plot is curved. If large amounts of water are being pumped, the friction loss through the pump becomes large. In addition to the frictional losses there is so called impact loss resulting from the impact of the water molecules hitting the impeller and the inlet and outlet parts of the pump chamber. The highest losses occur with large heads and large flows at the ends of the pump characteristics curve, close to the x- and y-axes. This is to be expected, because a pump has the highest efficiency at its construction point in the middle of
A pump’s characteristics will of course depend on design and size of the chosen impeller, each of which will have individual characteristics. A centrifugal pump can normally be delivered with different impellers, and it is quite easy to change them. In many cases several pump characteristics are given in the same diagram, one for each diameter of the impeller.
The pump diagram may also show a plot of pump efficiency versus discharge. A pump that works as closely as possible to the maximum efficiency (con-struction point) should be chosen; operation away from the construction point will result in decreased efficiency. Pump efficiency may also be given in the so-called shell or muscle diagrams in which curves and/or circles represent percentage efficiency.
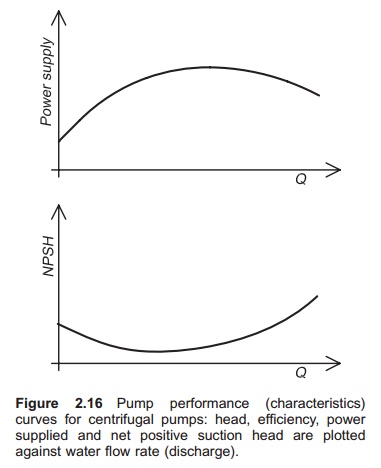
The power requirements are also given in the pump diagram. Here the necessary power that must be supplied to the pump is plotted versus different discharges and heads.
The NPSH curve gives information about the necessary ‘over-pressure’ required by the pump which, as described earlier, increases with increas-ing water flow. It is important to be aware that the curve showing the NPSH is constructed in relation to atmospheric pressure, i.e. 10.3 mH2O. The sup-plied (inlet) pressure is the sum of the air pressure and water pressure to the pump impeller. If this is lower than the NPSH requirements shown on the curve, the pump willcavitate. There will not nor-mally be problems with NPSH if there is positive water pressure into the pump. Problems are more likely to occur when there is static suction lift into the pump.
Pipeline characteristics
When delivering water through a pipeline, the pres-sure and/or head that the pump has to deliver depends on the flow rate to be pumped through the pipe. If the pump is not running, the only resistance is the fixed static head; however, when the pump starts to work there is in addition a resistance head (manometric head) caused by friction losses in the pipe.
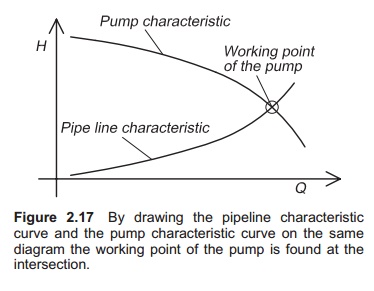
The manometric head increases with the flow rate through the pipe. If the pump does not lift the water to a higher level, but only overcomes friction in the pipes, there is no static head, but only a resis-tance head. To find the total friction, the character-istics of the total pipe system, including pipe length, pipe material, number of bends, etc., must be known. With this information the total head lossthrough the system with different water flows can be calculated. The results may be plotted to show the connection between the total head and the water flow. This curve is called the pipeline characteristic curve. It starts at zero if there is no start head and increases exponentially with the water flow (Fig. 2.17).
Working point
To find the working point for a pump with given pipeline characteristics, the pipeline and pump characteristic curves can be drawn on the same diagram (Fig. 2.17). The actual working point of the pump will be at the intersection of the two curves. This point shows the water flow that the pump will deliver through the pipeline. To achieve the best possible efficiency it is important that this point is as close to the construction point of the pump as possible. If not, another pump should be chosen.
Related Topics