Measures of central tendency - Geometric mean | 11th Business Mathematics and Statistics(EMS) : Chapter 8 : Descriptive statistics and probability
Chapter: 11th Business Mathematics and Statistics(EMS) : Chapter 8 : Descriptive statistics and probability
Geometric mean
Geometric mean
Geometric
mean is defined as the nth root of the product of n observations or values.
If there are two observations, we
take the square root; if there are three observations we have to take the cube
root and so on

where X 1 , X2
, X 3 ,...., Xn refer to the various items
of the series which are all greater than zero and n refers number of
observations.
Thus the geometric mean of 3
values 2,3,4 would be

When the number of items is three
or more the task of multiplying the numbers and of extracting the root becomes
excessively difficult. To simplify calculations, logarithms are used. Geometric
mean is calculated as follows:
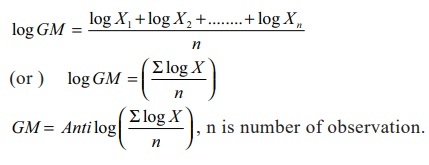
(i) In discrete observation

(ii) In Continuous
observation

Example 8.5
Daily income (in Rs) of ten
families of a particular place is given below. Find out GM
85, 70, 15, 75, 500, 8, 45, 250, 40, 36
Solution:
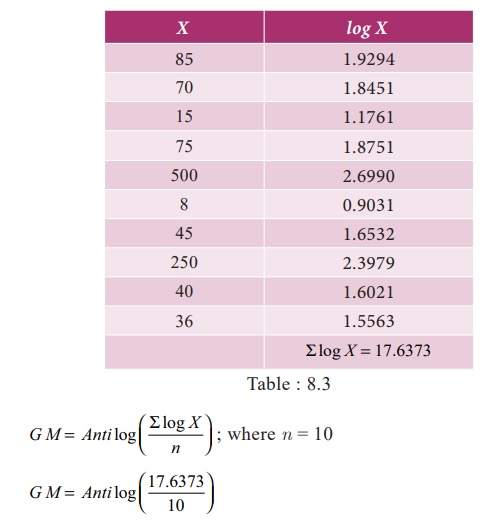
Anti log(1.7637)
GM =
58.03
Example 8.6
Calculate
the geometric mean of the data given below giving the number of families and
the income per head of different classes of people in a village of Kancheepuram
District.
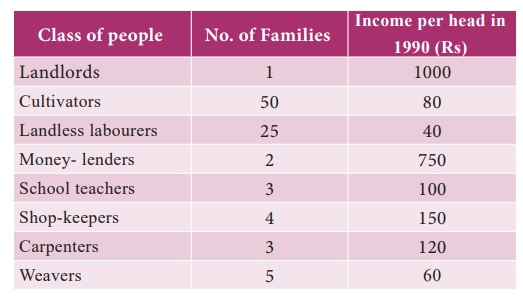
Solution:
Calculation
of Geometric Mean
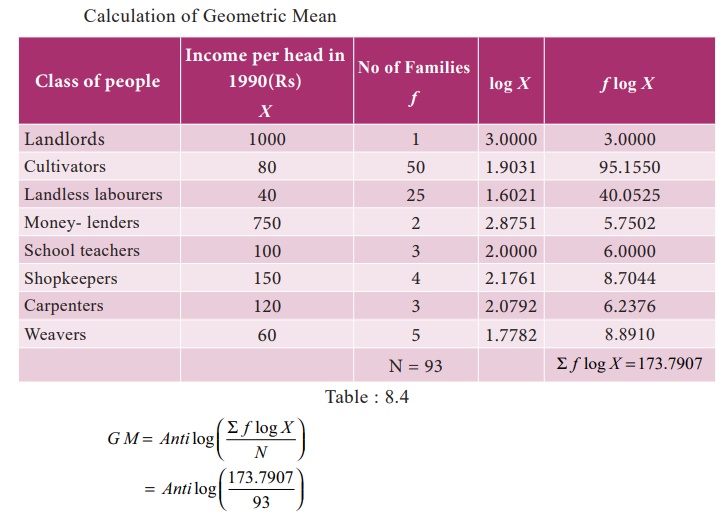
Anti log (1.8687)
GM =
73.95
Example 8.7
Compute
the Geometric mean from the data given below

Solution:
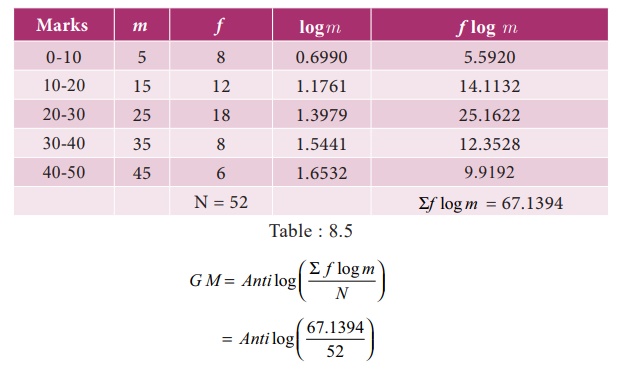
Anti log (1.2911)
GM =
19.55
Specific uses of Geometric mean
The most useful application of
geometric mean is to average the rate of changes. For example, from 2006 to
2008 prices increased by 5%, 10% and 18% respectively.
The
average annual increase is not 11% (5 + 10 + 18) / 3 = 11 as given by the
arithmetic average but 10.9% as obtained by the geometric mean. This average is
also useful in measuring the growth of population, because population increases
in geometric progression.
Example 8.8
Compared
to the previous year the overhead expenses went up by 32% in 1995, they
increased by 40% in the next year and by 50% in the following year. Calculate
the average rate of increase in overhead expenses over the three years.
Solution:
In
averaging ratios and percentages, geometric mean is more appropriate. Let us
consider X represents Expenses at the
end of the year.
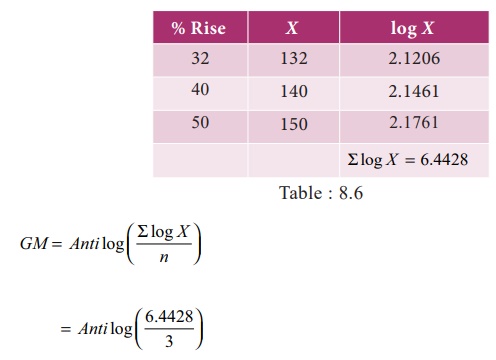
Anti log ( 2.1476)
GM = 140.5
Average
rate of increase in overhead expenses
140.5 –
100 = 40.5 %
Related Topics