Measures of central tendency - Computations for Related positional measure | 11th Business Mathematics and Statistics(EMS) : Chapter 8 : Descriptive statistics and probability
Chapter: 11th Business Mathematics and Statistics(EMS) : Chapter 8 : Descriptive statistics and probability
Computations for Related positional measure
Computations for Related positional measure
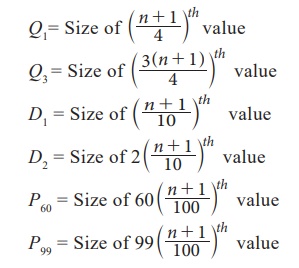
The procedure for computing quartiles, deciles and percentiles are the same as the median.
(i) Ungrouped data: Steps:
1. Arrange the data either in ascending or descending order of magnitude.
2. Apply the formula
Example 8.1
Find D2 and D6 for the following series 22, 4, 2, 12, 16, 6, 10, 18, 14, 20, 8
Solution :
Here n = 11 observations are arranged into ascending order 2, 4, 6, 8, 10, 12, 14, 16, 18, 20, 22

D2 = size of 2.4th value Ōēłsize of 2nd value = 4
D6 = size of 7.2th value Ōēłsize of 7th value =14
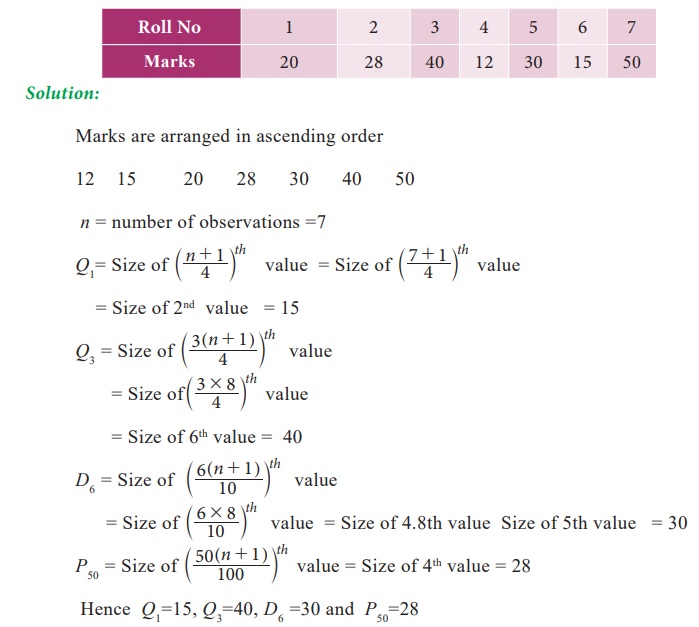
Example 8.2
Calculate the value of Q1, Q3, D6 and P50 from the following data
(ii) Grouped data (discrete case):
Steps:
1. Arrange the data in ascending or descending order of magnitude.
2. Find out cumulative frequencies.
3. Apply the formula:
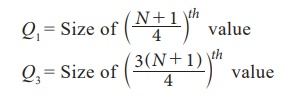
Now look at the cumulative frequency (cf) column and find that total which is either equal to ( N+1 / 4 ) or next higher than that and determine the value of the variable corresponding to this. That gives the value of Q1. Similarly Q3 is determined with reference of 3(N+1) / 4 value of the variable.
Example 8.3
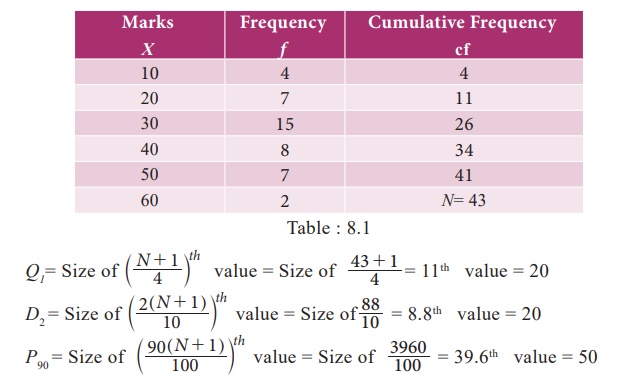
Compute Q1, D2 and P90 from the following data

Solution :
(iii) Grouped data (Continuous case):
In the case of continuous frequency distribution, the classes are arranged either in ascending or descending order and the class corresponding to the cumulative frequency (cf ) just equal or greater than (N/4) is called Q1 class and the value of Q1is obtained by the following formula:

where L is the lower limit of the Q1 class,
f is the frequency of the Q1 class,
c is the magnitude of the Q1 class,
pcf is the cumulative frequency of the pre Q1 class.
Similarly third quartile value can be obtained by the same procedure with Q3class by the following formula:

where L is the lower limit of the third quartile class,
f is the frequency of the third quartile class,
c is the magnitude of the third quartile class,
pcf is the cumulative frequency of the pre Q3 class
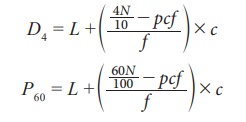
Similarly the same procedure is to be followed for other positional measures such as deciles and percentiles,
Example 8.4
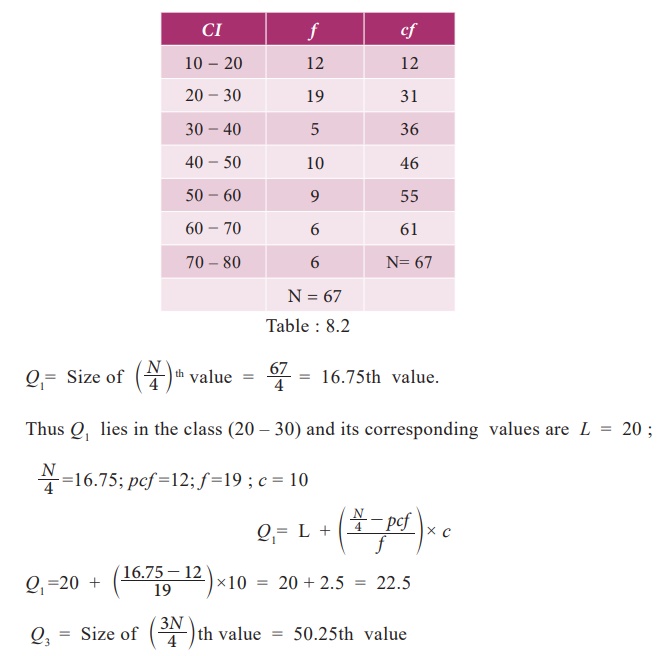
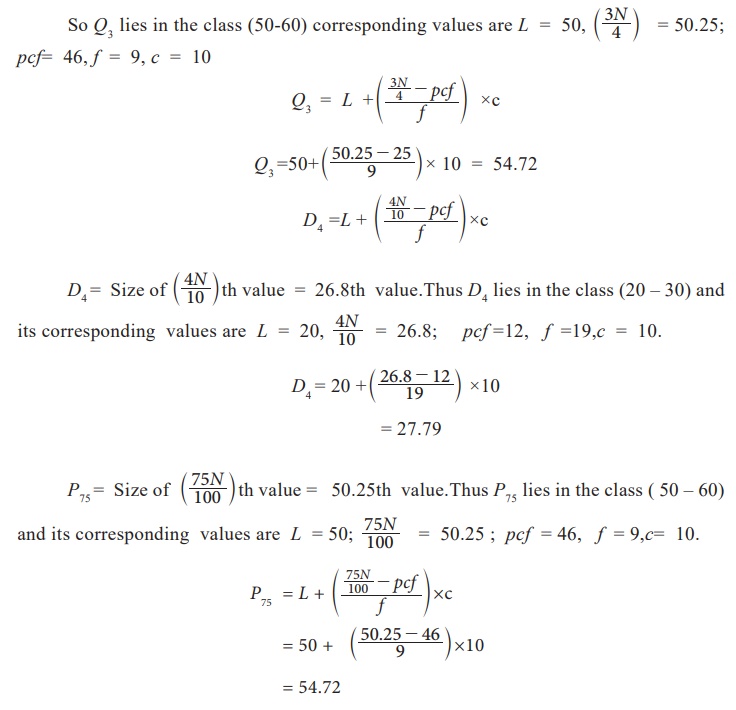
Compute upper Quartiles, lower Quartiles, D4 and P60, P75 from the following data

Solution:
Related Topics