Chapter: Data Warehousing and Data Mining : Association Rule Mining and Classification
Bayesian Classification
Bayesian
Classification
“What are Bayesian classifiers?” Bayesian
classifiers are statistical classifiers. They can predict class membership probabilities, such as the probability
that a given tuple belongs to a particular class.
Bayesian
classification is based on Bayes’ theorem, a simple Bayesian classifier known
as the naïve Bayesian classifier Bayesian classifiers have also exhibited high
accuracy and speed when applied to
large databases.
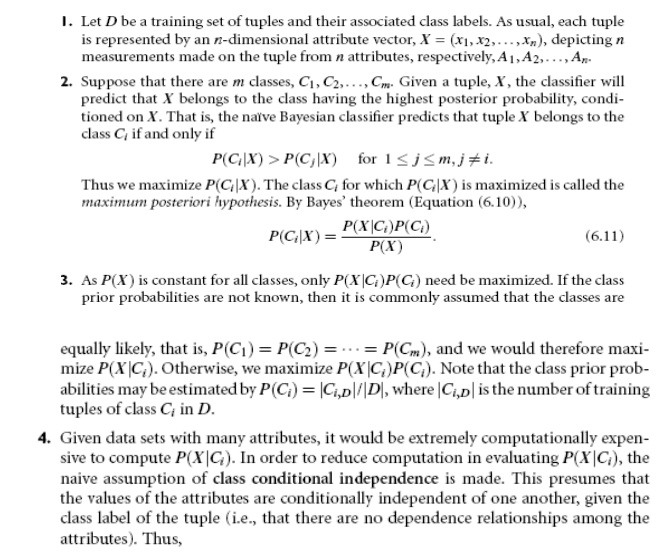
1. Bayes’ Theorem
. Let X
be a data tuple. In Bayesian terms, X is considered ―evidence.‖ As
usual, it is described by measurements made on a set of n attributes. Let H be
some hypothesis, such as that the data tuple X belongs to a specified
class C. For classification problems,
we want to determine P(HjX), the probability that the
hypothesis H holds given the
―evidence‖ or observed data tuple X. In other words, we are looking
for the probability that tuple X belongs to class C, given that we know the attribute
description of X.
“How are these probabilities
estimated?” P(H), P(XjH), and P(X)
may be estimated from the given data,
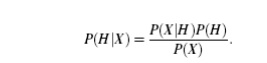
as we shall see below. Bayes’ theorem is useful in that it provides a way of calculating
the posterior probability, P(HjX), from P(H), P(XjH), and P(X).
Bayes’ theorem is
2. Naïve
Bayesian Classification
Bayesian
Belief Networks
.A belief
network is defined by two components—a directed
acyclic graph and a set of conditional
probability tables (Figure 6.11). Each node in the directed acyclic graph
represents a random variable. The
variables may be discrete or continuous-valued. They may correspond to actual
attributes given in the data or to ―hidden variables‖ believed to form a
relationship (e.g., in the case of medical data, a hidden variable may indicate
a syndrome, representing a number of symptoms that, together, characterize a
specific disease). Each arc represents a probabilistic dependence. If an arc is
drawn from a node Y to a node Z, then Y is a parent or immediate predecessor of Z, and Z is a descendant of
Y. Each variable is conditionally independent of its non descendants in the graph, given its parents.
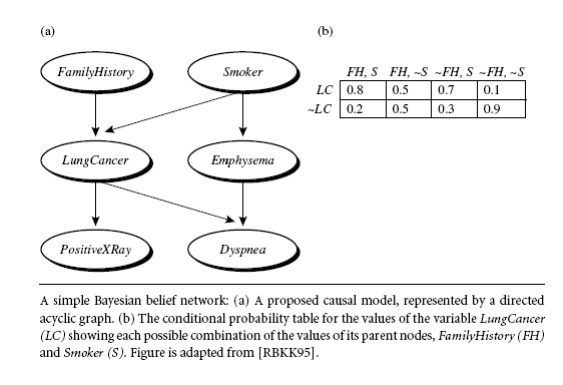
A belief
network has one conditional probability table (CPT) for each variable. The CPT
for a variable Y specifies the
conditional distribution P(YjParents(Y)), where Parents(Y) are the
parents of Y. Figure(b) shows a CPT
for the variable LungCancer. The
conditional probability for each known value of LungCancer is given for each possible combination of values of its
parents. For instance, from the upper leftmost and bottom rightmost entries,
respectively, we see that

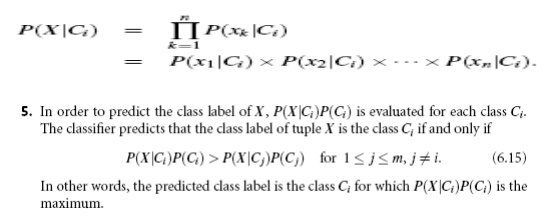
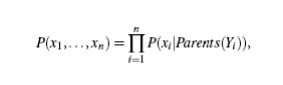
Let X
= (x1, : : : , xn) be a data tuple described by the variables or attributes Y1, : : : , Yn, respectively. Recall that each variable is conditionally
independent of its non descendants in the network graph, given its parents.
This allows the network to provide a complete representation of the existing
joint probability distribution with the
following
equation:
Related Topics