Chapter: Civil : Principles of Solid Mechanics : Slip Line Analysis
An Approximate тАЬCoulomb MechanismтАЭ
An Approximate тАЬCoulomb MechanismтАЭ
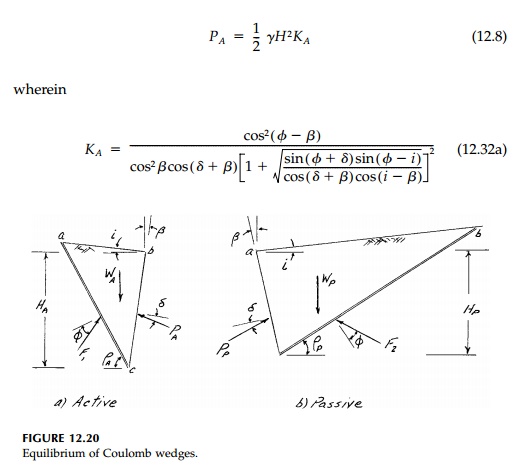
For the Coulomb wedge
in the active case, the free body diagram for no cohesion is as shown in Figure
12.20a. Let i be the angle at which the surface of the backfill rises
above the horizontal, ╬▓ be the angle between the wall and the plane, which is vertical to the
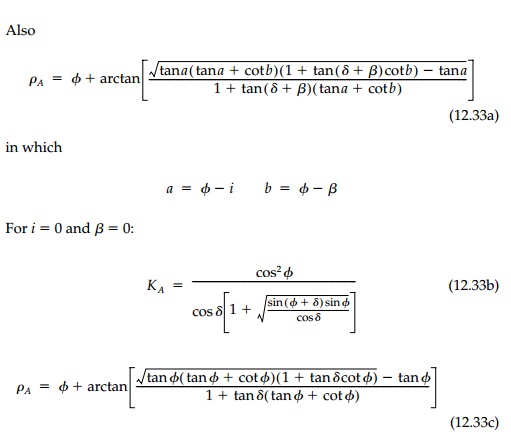
horizontal surface of the ground in front of the wall, and ╧БA
be the angle between the failure surface and the horizontal.
From the force
equilibrium of the failure wedge, the maximum value of PA,
the total force acting on the wall, is:
Similarly, the corresponding
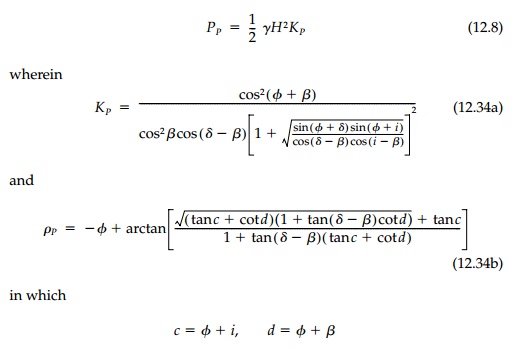
expression for the passive thrust (the free body diagram is shown in Figure
12.20b) is:
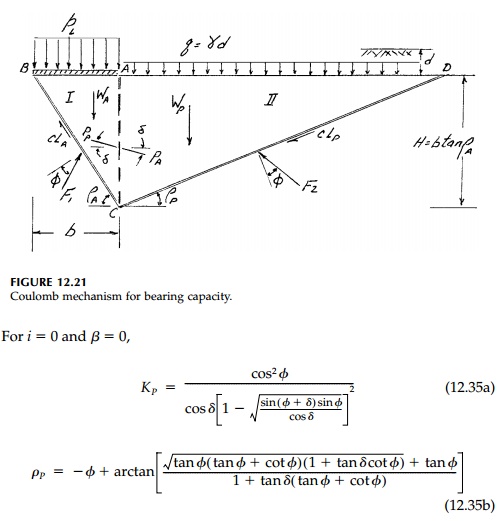
A very useful simplification of the Prandtl or Sokolovski failure surfaces is, as shown in Figure 12.21, to eliminate the fanshaped transition zone and thereby average its effect concentrating the shear transfer at AC. Line AC can then be thought of as a retaining wall with the active lateral thrust PA from region I pushing against the passive resistance PP from region III. From equilibrium of the two Coulomb wedges involved, bearingcapacity factors for each component of strength can be derived. Considering first the surcharge (c = ╬│ = 0)

Similarly, considering
only the contribution of the weight of the soil below the footing (q =
c = 0), at collapse
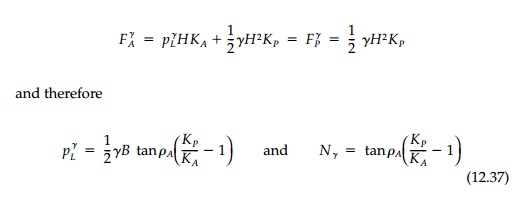
Finally, it might be noted that for only cohesion ( ╧Х =0), equilibrium considerations of the Coulomb mechanism gives a value of Nc = 6.0, which is not unreasonable compared to the exact value of 5.14.
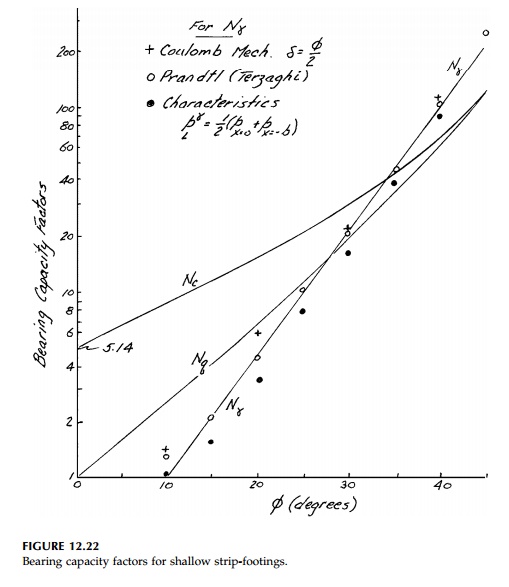
The corresponding staticbearing capacity factors Nq and N╬│ for a granular soil for various values of ╧Х and ╬┤ can now be calculated for the Coulomb mechanism from Equations (12.36) and (12.37) with the expressions for KA, KP, and ╧БA. The results are shown in Table 12.2 compared to the corresponding values for the Prandtltype mechanism and solution by the method of characteristics. For the correct kinematic Coulomb mechanism, the wedges must slip relative to each other and ╬┤=╧Х. This, by the upperbound theorem of limit analysis, must overestimate the bearing capacity, which it does. However, since the fictitious wall replaces the fanshaped transition zone, it should average the shear transfer, and setting ╬┤=╧Х/2 seems more reasonable as an approximation. As shown in Table 12.1, such an assumption for ╬┤ does in fact give a very good correlation (┬▒ ~ 10%) between the mechanisms for all values of ╧Х. The values for N╬│ by the method of characteristics in Table 12.2 are those given by Sokolovski. His values seem to have been computed by simply taking the average

rather than computing
the limit load PL using the integral of the limit pressure
distribution. Therefore, they are unnecessarily low since both the curvatures
of the actual critical load intensity computed and its eccentricity are
neglected. If we assume the distribution is parabolic, the value is ~15%
higher, which is a better representation but still conservative. This modification
is reflected in Figure 12.22 which gives the standard accepted value for
bearing capacity factors for design of shallow strip footings.
Related Topics