Chapter: Basic & Clinical Pharmacology : Drug Receptors & Pharmacodynamics
Dose & Response in Patients
Dose & Response in Patients
A. Graded Dose-Response Relations
To
choose among drugs and to determine appropriate doses of a drug, the prescriber
must know the relative pharmacologicpotency
and maximal efficacy of the
drugs in relation to thedesired therapeutic effect. These two important terms,
often con-fusing to students and clinicians, can be explained by referring to
Figure 2–15, which depicts graded dose-response curves that relate the dose of
four different drugs to the magnitude of a particular therapeutic effect.
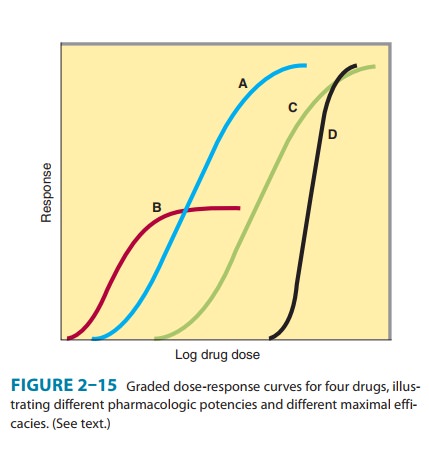
1. Potency—Drugs A and B are said
to be more potent thandrugs C and D because of the relative positions of their
dose-re-sponse curves along the dose
axis of Figure 2–15. Potency refers to the concentration (EC50)
or dose (ED50) of a drug required to produce 50% of that drug’s
maximal effect. Thus, the pharmaco-logic potency of drug A in Figure 2–15 is
less than that of drug B, a partial agonist because the EC50 of A is
greater than the EC50 of B. Potency of a drug depends in part on the
affinity (Kd) of recep-tors for binding the drug and in part on the
efficiency with which drug-receptor interaction is coupled to response. Note
that some doses of drug A can produce larger effects than any dose of drug B,
despite the fact that we describe drug B as pharmacologically more potent. The
reason for this is that drug A has a larger maxi-mal efficacy (as described
below).
For
clinical use, it is important to distinguish between a drug’s potency and its
efficacy. The clinical effectiveness of a drug depends not on its potency (EC50),
but on its maximal efficacy and its
ability to reach the relevant receptors. This ability can depend on its route
of administration, absorption, distribution through the body, and clearance
from the blood or site of action. In deciding which of two drugs to administer
to a patient, the prescriber must usually consider their relative
effec-tiveness rather than their relative potency. Pharmacologic potency can
largely determine the administered dose of the chosen drug.
For
therapeutic purposes, the potency of a drug should be stated in dosage units,
usually in terms of a particular therapeutic end point (eg, 50 mg for mild
sedation, 1 mcg/kg/min for an increase in heart rate of 25 bpm). Relative
potency, the ratio of equi-effective doses (0.2, 10, etc), may be used in comparing
one drug with another.
2. Maximal efficacy—This parameter
reflects the limit of thedose-response relation on the response axis. Drugs A, C, and D in Figure 2–15 have equal maximal
efficacy, and all have greater maximal efficacy than drug B. The maximal
efficacy (sometimes referred to simply as efficacy) of a drug is obviously
crucial for making clinical decisions when a large response is needed. It maybe
determined by the drug’s mode of interactions with receptors (as with partial
agonists∗ or by characteristics
of the receptor-effec-tor system involved.
Thus,
diuretics that act on one portion of the nephron may produce much greater
excretion of fluid and electrolytes than diuretics that act elsewhere. In
addition, the practical efficacy of a
drug for achieving a therapeutic end point (eg, increased cardiac
contractility) may be limited by the drug’s propensity to cause a toxic effect
(eg, fatal cardiac arrhythmia) even if the drug could otherwise produce a
greater therapeutic effect.
B. Shape of Dose-Response Curves
Although
the responses depicted in curves A, B, and C of Figure 2–15 approximate the
shape of a simple Michaelis-Menten rela-tion (transformed to a logarithmic
plot), some clinical responses do not. Extremely steep dose-response curves
(eg, curve D) may have important clinical consequences if the upper portion of
the curve represents an undesirable extent of response (eg, coma caused by a
sedative-hypnotic). Steep dose-response curves in patients can result from
cooperative interactions of several differ-ent actions of a drug (eg, effects
on brain, heart, and peripheral vessels, all contributing to lowering of blood
pressure).
C. Quantal Dose-Effect Curves
Graded
dose-response curves of the sort described above have certain limitations in
their application to clinical decision making. For example, such curves may be
impossible to construct if the pharmacologic response is an either-or (quantal)
event, such as prevention of convulsions, arrhythmia, or death. Furthermore,
the clinical relevance of a quantitative dose-response relation in a single
patient, no matter how precisely defined, may be limited in application to
other patients, owing to the great potential vari-ability among patients in
severity of disease and responsiveness to drugs.
Some
of these difficulties may be avoided by determining the dose of drug required
to produce a specified magnitude of effect in a large number of individual
patients or experimental animals and plotting the cumulative frequency
distribution of responders versus the log dose (Figure 2–16). The specified
quantal effect may be chosen on the basis of clinical relevance (eg, relief of
headache) or for preservation of safety of experimental subjects (eg, using low
doses of a cardiac stimulant and specifying an increase in heart rate of 20 bpm
as the quantal effect), or it may be an inherently quan-tal event (eg, death of
an experimental animal). For most drugs, the doses required to produce a
specified quantal effect in indi-viduals are lognormally distributed; that is,
a frequency distribu-tion of such responses plotted against the log of the dose
produces a gaussian normal curve of variation (colored areas, Figure 2–16).
When these responses are summated, the resulting cumulative frequency
distribution constitutes a quantal dose-effect curve (or dose-percent curve) of
the proportion or percentage of individuals who exhibit the effect plotted as a
function of log dose.
The
quantal dose-effect curve is often characterized by stating the median effective dose (ED50),
which is the dose at which 50% of individuals exhibit the specified quantal
effect. (Note that the abbreviation ED50 has a different meaning in
this context from its meaning in relation to graded dose-effect curves,
described in previous text). Similarly, the dose required to produce a
particular toxic effect in 50% of animals is called the median toxic dose(TD50). If the toxic effect is death of
the animal, a median lethal dose (LD50)
may be experimentally defined. Such values providea convenient way of
comparing the potencies of drugs in experimental and clinical settings: Thus,
if the ED50s of two drugs for producing a specified quantal effect
are 5 and 500 mg, respec-tively, then the first drug can be said to be 100
times more potent than the second for that particular effect. Similarly, one
can obtain a valuable index of the selectivity of a drug’s action by comparing
its ED50s for two different quantal effects in a population (eg,
cough suppression versus sedation for opioid drugs).
Quantal
dose-effect curves may also be used to generate informa-tion regarding the
margin of safety to be expected from a particular drug used to produce a
specified effect. One measure, which relates the dose of a drug required to
produce a desired effect to that which produces an undesired effect, is the therapeutic index. In animal studies,
the therapeutic index is usually defined as the ratio of the TD50 to
the ED50 for some therapeutically relevant effect. The pre-cision
possible in animal experiments may make it useful to use such a therapeutic
index to estimate the potential benefit of a drug in humans. Of course, the
therapeutic index of a drug in humans is almost never known with real
precision; instead, drug trials and accumulated clinical experience often
reveal a range of usually effec-tive doses and a different (but sometimes
overlapping) range of possibly toxic doses. The clinically acceptable risk of
toxicity depends critically on the severity of the disease being treated. For
example, the dose range that provides relief from an ordinary head-ache in the
majority of patients should be very much lower than the dose range that
produces serious toxicity, even if the toxicity occurs in a small minority of
patients. However, for treatment of a lethal disease such as Hodgkin’s
lymphoma, the acceptable difference between therapeutic and toxic doses may be
smaller.
Finally,
note that the quantal dose-effect curve and the graded dose-response curve
summarize somewhat different sets of infor-mation, although both appear sigmoid
in shape on a semilogarith-mic plot (compare Figures 2–15 and 2–16). Critical
information required for making rational therapeutic decisions can be obtained
from each type of curve. Both curves provide information regard-ing the potency and selectivity of drugs; the graded dose-response curve indicates the maximal efficacy of a drug, and the
quantal dose-effect curve indicates the potential variability of responsive-ness among individuals.
Related Topics