Botany : Chromosomal Basis of Inheritance - Genetic Mapping | 12th Botany : Chapter 3 : Chromosomal Basis of Inheritance
Chapter: 12th Botany : Chapter 3 : Chromosomal Basis of Inheritance
Genetic Mapping
Genetic Mapping
Genes are present in a
linear order along the chromosome. They are present in a specific location
called locus (plural: loci). The diagrammatic representation of position
of genes and related distances between the adjacent genes is called genetic
mapping. It is directly proportional to the frequency of
recombination between them. It is also called as linkage map. The
concept of gene mapping was first developed by Morgan’s student Alfred H
Sturtevant in 1913. It provides clues about where the genes lies on
that chromosome.
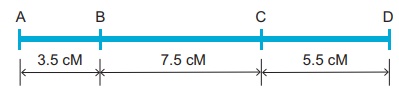
Map distance
The unit of distance in
a genetic map is called a map unit (m.u). One map unit is equivalent to
one percent of crossing over (Figure 4. ). One map unit is also called a
centimorgan (cM) in honour of T.H. Morgan. 100 centimorgan is equal to
one Morgan (M). For example: A distance between A and B genes is estimated to
be 3.5 map units. It is equal to 3.5 centimorgans or 3.5 % or 0.035
recombination frequency between the genes.
Genetic maps can be constructed
from a series of test crosses for pairs of genes called two point
crosses. But this is not efficient because double cross over is
missed.
Three point test cross
A more efficient mapping
technique is to construct based on the results of three-point test cross. It
refers to analyzing the inheritance patterns of three alleles by test crossing
a triple recessive heterozygote with a triple recessive homozygote. It enables
to determine the distance between the three alleles and the order in which they
are located on the chromosome. Double cross overs can be detected which will
provide more accurate map distances.
Three-point test cross can be best understood by considering following an example.
In maize (corn), the
three recessive alleles are
1. l for lazy or prostrate growth habit
2. g for glossy leaf
3. s for sugary endosperm
These three recessive
alleles (l g s) are crossed with wild type dominant alleles (L G S).
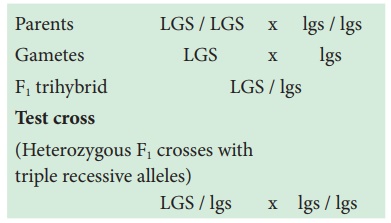
Parents LGS / LGS x lgs / lgs
Gametes LGS x lgs
F1 trihybrid LGS / lgs
Test cross
(Heterozygous F1
crosses with
triple recessive
alleles)
LGS / lgs x lgs / lgs
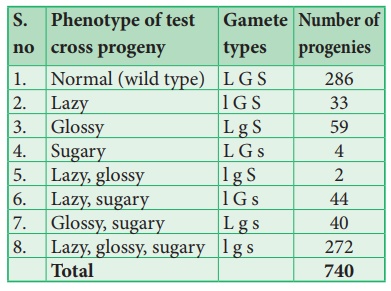
This trihybrid test
cross produces 8 different types (23=8) of gametes in which 740 progenies are
observed. The following table shows the result obtained from a test cross of
corn with three linked genes.
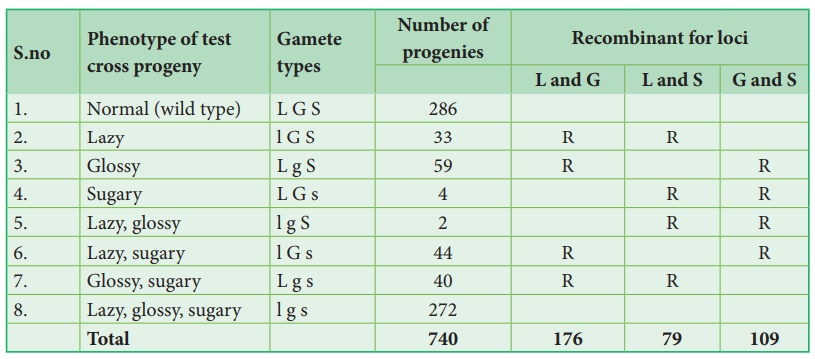
The analysis of a three-point cross:
From the above result,
we must be careful to observe parental (P) and recombinant (R) types. First
note that parental genotypes for the triple homozygotes are L G S and l g s,
then analyse two recombinant loci at a time orderly L G/ l g, L S/ l s and G S/
g s. In this any combination other than these two constitutes a recombinant
(R).
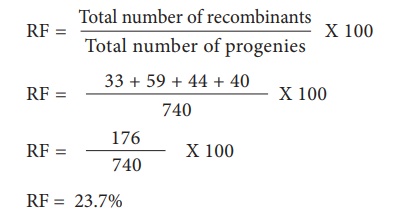
Let’s analyse the loci
of two alleles at a time starting with L and G Since the L G and l g parental
genotypes the recombinants will be L g and l G. The Recombinant frequency (RF)
for these two alleles can be calculated as follows
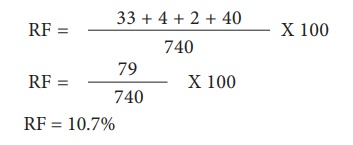
For L and S loci, the
recombinants are L s and l S. The Recombinant frequency (RF) will be as follows
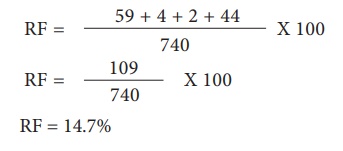
For G and S loci, the
recombinants are G s and g S. The Recombinant frequency (RF) will be as follows
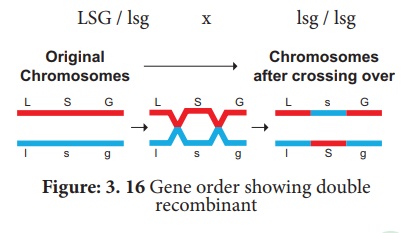
All the loci are linked,
because all the RF values are considerably less than 50%. In this L G loci show
highest RF value, they must be farthest apart. Therefore, the S locus must lie
between them. The order of genes should be l s g. A genetic map can be drawn as
follows: (Figure 3.15)
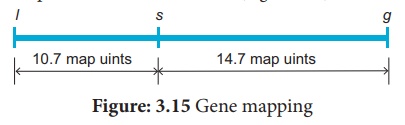
A final point note that two smaller map distances, 10.7 m.u and 14.7., is add up to 25.4 m.u., which is greater than 23.7 m.u., the distance calculated for l and g. we must identify the two least number of progenies (totaling 8) in relation to recombination of L and G. These two least progenies are double recombinants arising from double cross over. The two least progenies not only counted once should have counted each of them twice because each represents a double recombinant progeny.
Hence, we can correct
the value adding the numbers 33+59+44+40+4+4+2+2=188. Of the total of 740, this
number exactly 25.4 %, which is identical with the sum of two component values.
The test cross parental
combination can be re written as follows:
Uses of genetic mapping
·
It is used to determine gene order, identify the locus of a gene
and calculate the distances between genes.
·
They are useful in predicting results of dihybrid and trihybrid
crosses.
·
It allows the geneticists to understand the overall genetic
complexity of particular organism.
Related Topics