Chapter: Medical Physiology: Urine Formation by the Kidneys: I. Glomerular Filtration, Renal Blood Flow, and Their Control
Filling of the Bladder and Bladder Wall Tone; the Cystometrogram
Filling of the Bladder and Bladder Wall Tone; the Cystometrogram
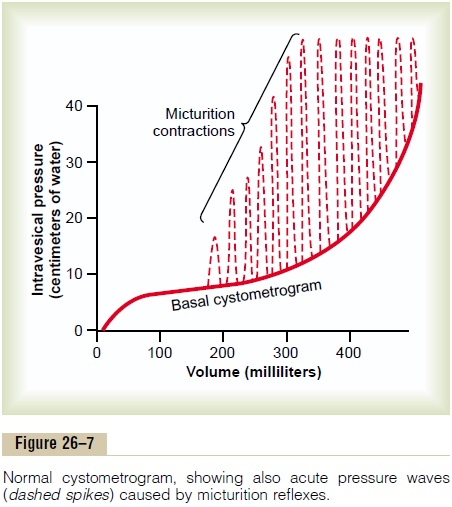
Figure 26–7 shows the approximate changes in intra-vesicular pressure as the bladder fills with urine. When there is no urine in the bladder, the intravesicular pres-sure is about 0, but by the time 30 to 50 milliliters of urine has collected, the pressure rises to 5 to 10 cen-timeters of water. Additional urine—200 to 300 milli-liters—can collect with only a small additional rise in pressure; this constant level of pressure is caused by intrinsic tone of the bladder wall itself. Beyond 300 to 400 milliliters, collection of more urine in the bladder causes the pressure to rise rapidly.

Superimposed on the tonic pressure changes during filling of the bladder are periodic acute increases in pressure that last from a few seconds to more than a minute. The pressure peaks may rise only a few cen-timeters of water or may rise to more than 100 centimeters of water. These pressure peaks are called micturition waves in the cystometrogram and are causedby the micturition reflex.

Related Topics