Chapter: Operations Research: An Introduction : Network Models
CPM AND PERT: Construction of the Time Schedule
Construction of the Time Schedule
This
section shows how the information obtained from the calculations in Previous Section can be used to develop the time schedule. We recognize that for an
activity (i, j), ði represents the earliest start
time, and Δj represents the latest completion (fine. TIlis
means that the interval (ðI , , Δj ) delineates the (maximum) span during which
activity (i, j) may be scheduled without delaying the entire project.
Construction of Preliminary Schedule. The method for constructing a preliminary
schedule is illustrated by an example.
Example 6.5-3
Determine
the time schedule for the project of Example 6.5-2 (Figure 6.42).
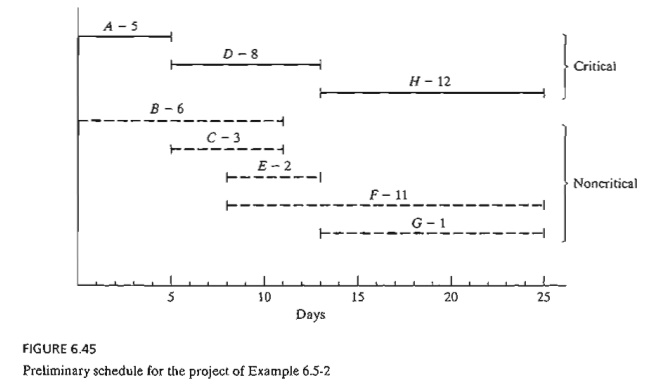
We can
get a preliminary time schedule for the different activities of the project by
delineating their respective time spans as shown in Figure 6.45. Two
observations are in order.
a.
The critical activities (shown by solid lines) must
be stacked one right after the other to ensure that the project is completed
within its specified 25-day duration.
b.
The noncritical activities (shown by dashed lines)
have time spans that are larger than their respective durations, thus allowing
slack (or "leeway") in scheduling them within their allotted time
intervals.
How
should we schedule the noncritical activities within their respective spans?
Normally, it is preferable to start each noncritical activity as early as
possible. In this manner, slack periods will remain opportunely available at
the end of the allotted span where they can be used to absorb unexpected delays
in the execution of the activity. It may be
necessary, however, to delay the start of a noncritical activity past its
earliest start time. For example, in Figure 6.45, suppose that each of the
noncritical activities E and F requires the use of a bulldozer,
and that only one is available. Scheduling both E and F as early as
possible requires two bulldozers between times 8 and 10. We can remove the
overlap by starting E at time 8 and pushing the start
time of F to somewhere between times 10 and 14.
If all the noncritical activities
can be scheduled as early as possible, the resulting schedule automatically is feasible.
Otherwise, some precedence relationships may be violated if noncritical
activities are delayed past their earliest time. Take for example activities C
and E in Figure 6.45. In the project network (Figure 6.42 ), though C must be
completed before E, the spans of C and E in
Figure 6.45 allow us to schedule C between times 6 and 9, and E between
times 8 and 10, which violates the requirement that C precede E. The need
for a "red flag" that automatical-ly reveals schedule conflict is
thus evident. Such information is provided by computing the floats for the noncritical activities.
Determination of the Floats. Floats
are the slack times available within the allotted span of the noncritical
activity. The most common are the total float and the free float.
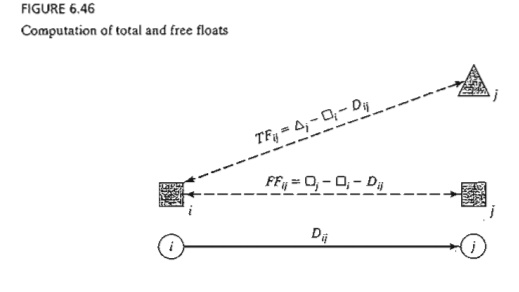
Figure
6.46 gives a convenient summary for computing the total float (TFij) and the free float (FFij) for an
activity (i, j). The total float is the excess of the time span defmed from the earliest occurrence of event i to the latest occurrence of event j over the duration of (i, j)-that is,

The free
float is the excess of the time span defined from the earliest occurrence of event i
to the earliest occurrence of event j over the
duration of (i, j)-that is,

Red-Flagging Rule. For a
noncritical activity (i, j)
(a) If F Fij = T Fij, then the activity can be scheduled anywhere within
its (ðj,Δj ) span without causing schedule conflict.
(b) If F Fij < T Fij, then the start of the activity can be delayed by
at most F Fij relative
to its earliest start time (ði ) without
causing schedule conflict. Any delay larger than F Fij (but not more than T Fij) must be coupled with an equal delay relative to ðj in the start time ofall the activities leaving node
j.
The
implication of the rule is that a noncritical activity (i, j) will be red-flagged if its F Fij < T Fij. This red
flag is important only if we decide to delay the start of the activity past its
earliest start time, ði, in which
case we must pay attention to the start times of the activities leaving node j to avoid
schedule conflicts.
Example
6.5-4
Compute
the floats for the noncritical activities of the network in Example 6.5-2, and
discuss their use in finalizing a schedule for the project.
The
following table summarizes the computations of the total and free floats. It is more convenient to do the
calculations directly on the network using the procedure in Figure 6.42.

The
computations red-flag activities Band C because their FF < TF. The remaining activities (E, F, and G) have F F = T F, and hence may be scheduled
anywhere between their earliest start and latest completion times.
To
investigate the significance of the red-flagged activities, consider activity B. Because
its T
F = 5 days,
this activity can start as early as time 0 or as late as time 5 (see Figure 6.45). However,
because its F F = 2 days,
starting B anywhere between time 0 and time 2 will have no effect on the
succeeding activities E and F. If, however, activity B must
start at time 2 + d (≤ 5),
then the start times of the immediately succeeding activities E and F must be
pushed forward past their earliest start time (= 8) by at least d. In this manner, the precedence
relationship between B and its successors E and F is
preserved.
Turning
to red-flagged activity C, we note that its F
F = O. This means that any delay in
starting C past its earliest start time (= 5) must be coupled with at least an
equal delay in the start of its successor activities E and F.
TORA Moment
TORA
provides useful tutorial tools for CPM calculations and for constructing the
time
schedule.
To use these tools, select Project Planning
=> CPM Critical Path Method from Main Menu. In the output screen, you have
the option to select CPM' Calculations to produce step-by-step computations of
the forward pass, backward pass, and the floats or CPM Bar Chart to construct
and experiment with the time schedule.
File
toraEx6.5-2.txt provides TORA's data Example 6.5-2. If you elect to generate the output
using the Next Step option, TORA will guide you through the details of the
forward and backward pass calculations.
Figure
6.47 provides the TORA schedule produced by CPM Bar Chart option for the
project of Example 6.5-2. The default bar chart automatically schedules all
noncrit-ical activities as early as possible. You can study the impact of
delaying the start time of a noncritical activity by using the self-explanatory
drop-down lists inside the bottom left frame of the screen. The impact of a
delay of a noncritical activity will be shown directly on the bar chart
together with an explanation. For example, if you delay the start of activity B by more
than 2 time units, the succeeding activities E and F will be
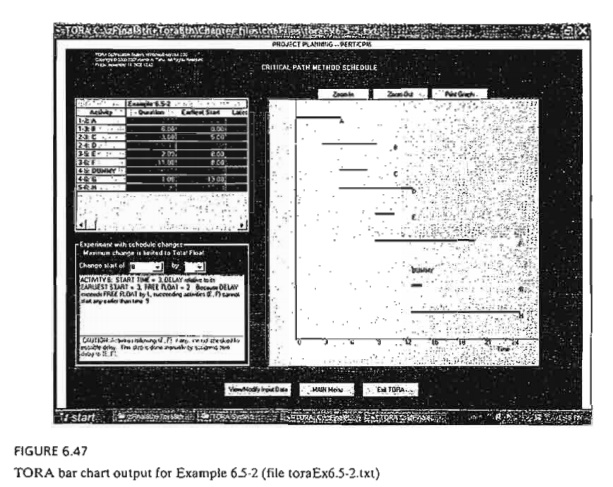
delayed
by an amount equal to the difference between the delay over the free float of
activity B. Specifically, given that the free float for B is 2 time units, if B is
delayed by 3 time units, then E and F must be delayed by at least 3 -
2 = 1 time unit. This situation is
demonstrated in Figure 6.47.
AMPLMoment
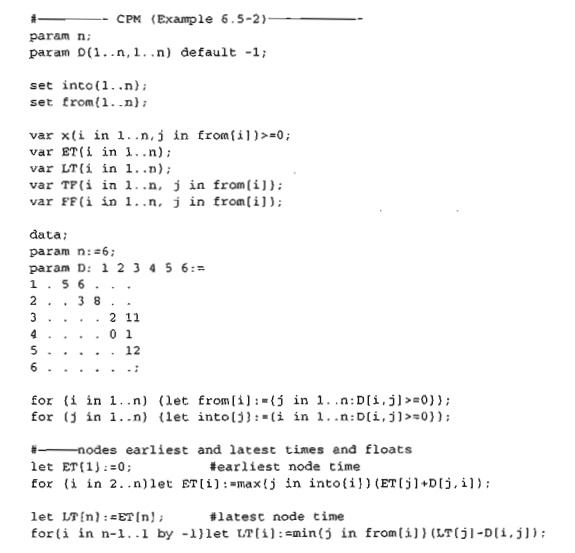
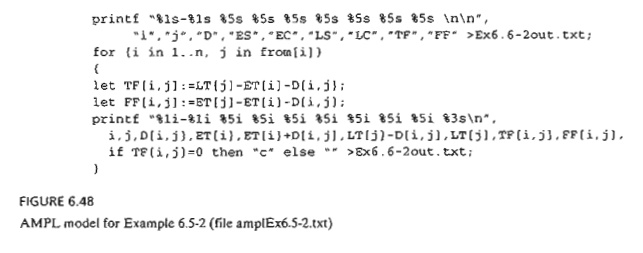
Figure
6.48 provides the AMPL model for the CPM (file amplEx6.52.txt). The model is
driven by the data of Example 6.5-2. This AMPL model is a unique application
because it uses indexed sets (see Section
A.4) and requires no optimization. In essence, no solve command is needed, and
AMPL is implemented as a pure programming language similar to Basic or C.
The
nature of the computations in CPM requires representing the network by
associating two indexed sets with
each node: into and from. For node i, the set into [i] defines all the nodes that feed
into node i, and the set from [i] defines all the nodes that are reached from
node i. For example, in Example 6.5-2,
from[l] = {2, 3} and into [1] is empty.
The
determination of subsets from and into is achieved in the model as follows:
Because D [ i , j ] can be zero when a CPM network
uses dummy activities, the default value for D [ i , j] is -1 for all nonexisting arcs. Thus,
the set from [ i] represents all the nodes j in the
set {1 .. n} that can be reached from node
i, which can happen only if D[i, j] >=0. This says that from[i] is defined
by the subset {j in 1. .n:D[i, j] > =O} .
Similar
reasoning applies to the determination of subsets into [i ]. The following AMPL
statements automate the determination of these sets and must follow the D [i, j] data, as
shown in Figure 6.48:

Once the
sets from and into have been determined, the model goes through the forward
pass to compute the earliest time, ET [ i] . With the completion of this pass,
we can initiate the backward pass by using

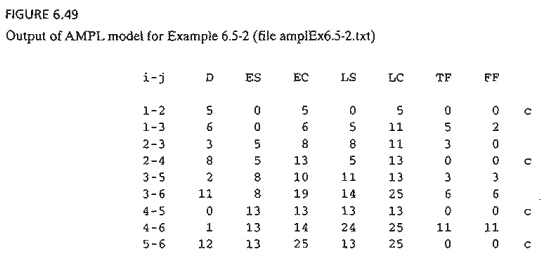
The rest
of the model is needed to obtain the output shown in Figure 6.49. This output
determines all the data needed to construct the CPM chart The logic of this
segment is based on the computations given in Examples 6.5-2 and 6.5-4.
PROBLEM SET 6.5C
1. Given
an activity (i, j) with duration Dij and its
earliest start time ði and its latest completion time Δj, determine the earliest completion
and the latest start times of (i,j).
2. What
are the total and free floats of a critical activity? Explain.
*3. For
each of the following activities, determine the maximum delay in the starting
time rel-ative to its earliest start time that will allow all the immediately
succeeding activities to be scheduled anywhere between their earliest and
latest completion times.
i.
T F = 10,
FF = 10, D = 4
ii.
TF = 10,FF = S,D = 4
iii.
TF = 1O,FF = O,D = 4
4. In
Example 6.5-4, use the floats to answer the following:
a.
If activity B is started at time 1, and
activity C is started at time 5, determine the earliest start times for E and F.
b.
If activity B is
started at time 3, and activity C is started at time 7, determine the earliest
start times for E and F.
c.
How is the scheduling of other activities impacted
if activity B starts at time 6?
*5. In
the project of Example 6.5-2 (Figure 6.42), assume that the durations of
activities B and F are
changed from 6 and 11 days to 20 and 25 days, respectively.
a.
Determine the critical path.
b. Determine
the total and free floats for the network, and identify the red-flagged
activities.
c.
If activity A is
started at time 5, determine the earliest possible start times for activi-ties
C, D, E,and G.
d.
If activities F, G, and H require the same equipment,
determine the minimum num-ber of units needed of this equipment.
6. Compute
the floats and identify the red-flagged activities for the projects (a) and (b)
in Figure 6.44, then develop the time schedules under the following conditions:
Project (a)
i.
Activity (1,5) cannot start any earlier than time
14.
ii. Activities
(5,6) and (5,7) use the same equipment, of which only one unit is available.
iii.
All other activities start as early as possible.
Project (b)
i.
Activity (1,3) must be scheduled at its earliest
start time while accounting for the requirement that (1,2), (1, 3), and (1,6)
use a special piece of equipment, of which 1 unit only is available.
ii.
All other activities start as early as possible.
Related Topics