Chapter: Medical Microbiology: An Introduction to Infectious Diseases: Immune Response to Infection
Antibody Production
Antibody Production
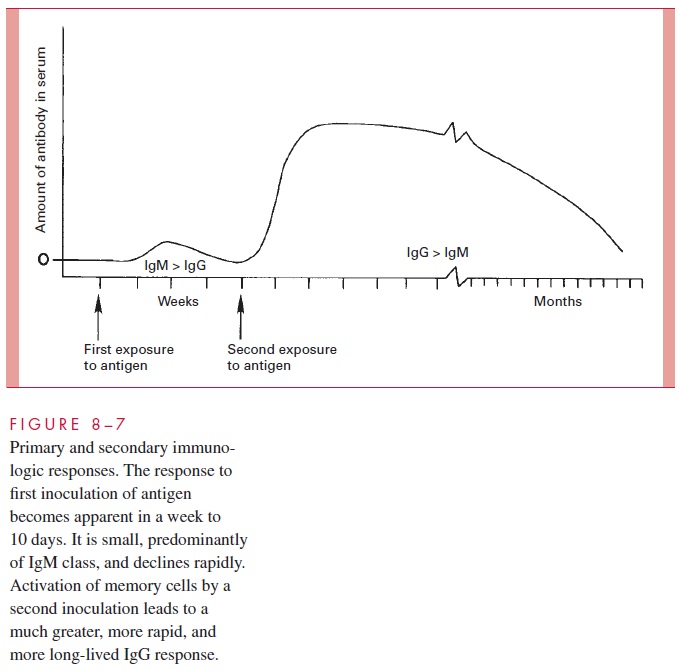
The major events characterizing the general phenomenon of antibody production are illustrated in Figure 8 – 7 and summarized as follows: Initial contact with a new antigen (primary stimulus) evokes the so-called primary response, which is characterized by a lag phase of approximately 1 week between the challenge and the detection of circulat-ing antibodies. In general, the length of the lag phase depends on the immunogenicity of the stimulating antigen and the sensitivity of the detection system for the antibodies produced. Immunogenicity, or the capacity to generate an immune response, is contin-gent on the state of the antigen when injected, the immunologic status of the animal, and the use of adjuvants or nonspecific amplifiers of immune reactivity. Once antibody is detected in serum, the levels rise exponentially to attain a maximal steady state in about 3 weeks. These levels then decline gradually with time if no further antigenic stimulation is given. The major antibodies synthesized in the primary immune response are the immune macroglobulins (IgM class). In the latter phase of the primary response, IgG antibodies arise, and these molecules eventually predominate. This transition is termed the IgM/IgG switch. Following a secondary or booster injection of the same antigen, the lag time between the immunization and the appearance of antibody is shortened, the rate of exponential increase to the maximum steady-state level is more rapid, and the steady-state level itself is higher, representing a larger amount of anti-body. Another key factor of thesecondary response is that the antibodies formed are predominantly of the IgG class. In addition to higher levels of antibody, the secondary IgG antibodies are often better antibodies in the sense that there has been a maturation in affinity of the combining sites so that the secondary antibodies are more effective at binding the antigen than were the IgM and initial IgG molecules produced. This process of affinity maturation results from a process of somatic mutation ongoing dur-ing the response.

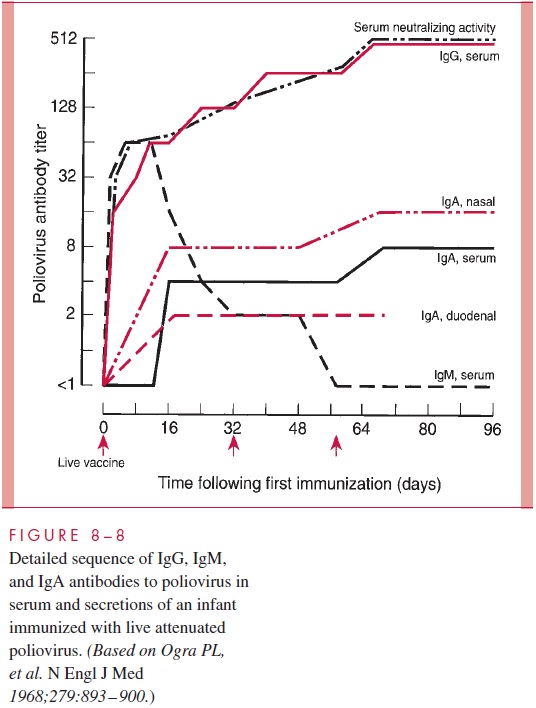
The preceding description of primary and secondary immune responses represents the idealized case that would be expected in normal individuals. Figure 8 – 8 illustrates the detailed sequence of IgG, IgM, and IgA antibodies to poliovirus that appears in the serum of a child who was immunized with three doses of attenuated live poliovirus. The inacti-vated virus was given at monthly intervals to a newborn beginning at 2 months of age. The contributions of serum IgM, IgG, and IgA antibodies are individually depicted. The overall capacity of the serum to neutralize the poliovirus is first detectable about 1 week following the primary immunization and reaches a plateau after the second immunization. The IgM antibody peaks at 1 week and gradually declines during the course of vaccina-tion. Primary IgG plateaus at approximately 2 weeks and increases with the secondary booster injection. IgA appears later than either IgM or IgG and is enhanced by secondary and tertiary boosts. It should be emphasized that in developing vaccines, the quantity or class of antibody produced is secondary to the biological effect. In the polio example, the serum IgA antibody is probably less important than that produced at the mucosal surfaces of the gut where it can block virus attachment.

Related Topics