Chapter: Digital Electronics : Synchronous and Asynchronous Sequential Circuits
ASM Chart
ASM CHART
Sooner
or later you will discover that state diagrams can become very messy. In many
cases just drawing a state diagram includes certain assumptions that are not
true in general. Perhaps certain cases of inputs will never happen, hence the
corresponding arcs are simply not drawn. Certain cases of outputs are not
significant and sometimes are left out. An algorithmic state machine (ASM)
diagram offers several advantages over state diagrams:
·
For
larger state diagrams, often are easier to intpret
·
conditions
for a proper state diagram are automatically satisfied
·
may be
easily coverted to other forms
A key
point to remember about ASM charts is that given a state, they do not enumerate
all the possible inputs and outputs. Only the inputs that matter and the outputs
that are asserted are indicated. It must be known whether a signal is positive
or negative logic:
·
Positive
logic signals that are high are said to be asserted
·
Negative
logic singals that are low are said to be asserted
In this
document, a _n suffix is added to indicate negative logic signals.
1. The ASM Block Diagram
An ASM
chart has an entry point and is constructed with blocks. A block is constucted
with the following type of symbols.
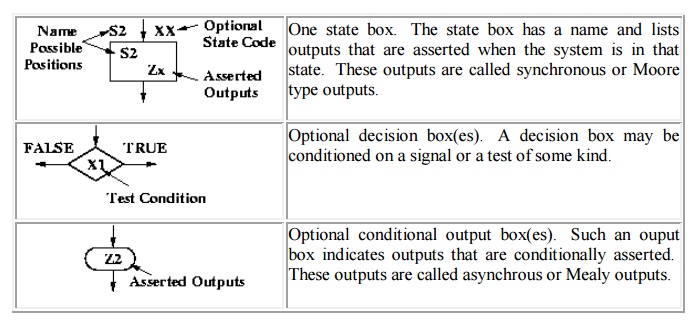
There is
no rule saying that outputs are exclusively inside an a conditional output box
or in a state box. An output written inside a state box is simply independent
of the input, while in that state.
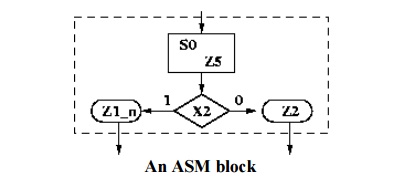
The idea
is that flow passes from ASM block to ASM block, the decisision boxes decide
the next state and conditional output. Consider the following example of an ASM
diagram block. When state S0 is entered, output Z5 is always asserted. Z1_n
however is asserted only if X2 is also high. Otherwise Z2 is asserted.
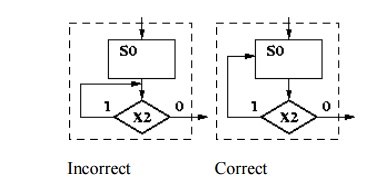
2. Certain Rules
The drawing
of ASM charts must follow certain necessary rules:
The
entrance paths to an ASM block lead to only one state box Of 'N' possible exit
paths, for each possible valid input combination, only one exit path can be
followed, that is there is only one valid next state.
No
feedback internal to a state box is allowed. The following diagram indicates
valid and invalid cases.
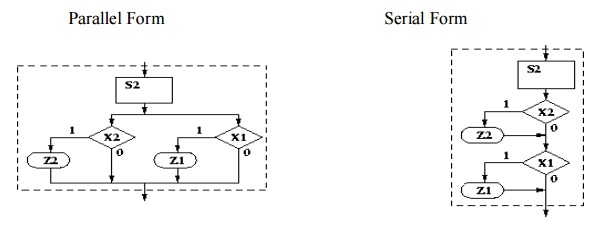
3. Parallel vs. Serial
We can
bend the rules, several internal paths can be active, provided that they lead
to a single exit path. Regardless of parallel or serial form, all tests are
performed concurrently. Usually we have a preference for the serial form. The
following two examples are equivalent.
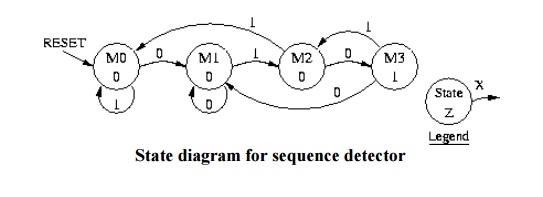
4. Sequence Detector Example
The use
of ASM charts is a trade-off. While the mechanics of ASM charts do reduce
clutter in significant designs, its better to use an ordinary state diagrams
for simple state machines. Here is an example Moore type state machine with
input X and output Z. Once the flag sequence is received, the output is
asserted for one clock cycle.
The
corresponding ASM chart is to the right. Note that unlike the state diagram
which illustrates the output value for each arc, the ASM chart indicates when
the output Z only when it is asserted.
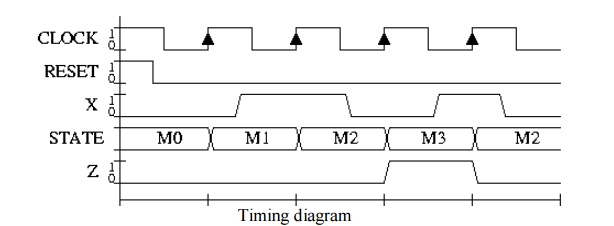
The
following timing diagram illustrates the detection of the desired sequence.
Here it is assumed that the state is updated with a rising clock edge. The key
concept to observe is that regardless of the input, the output can only be asserted
for one entire clock cycle.
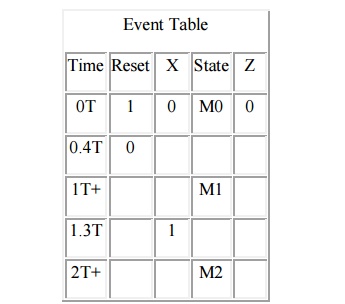
5. Event Tables
Simply
stated, timing diagrams are prone to a particular problem for the reader, in
that there can be too much to see. Timing diagrams clearly expresses time
relationships and delay. However, in synchonous sequential logic, all registers
are updated at the rising edge of the system clock. The clock period is just
set to an arbitrarily value. Provided that the input setup-and-hold
requirements are satisfied, the details of the timing diagram are distracting.
The goal
of an event table is that given a scenario, to neatly summarize the resultant
behavior of synchronous sequential logic. In writing an event table, capitol T
refers to the system clock period and nT means n times the system clock period.
For asynchronous input changes, the time is given, assuming that the system
output reacts instantaneously. For synchronous signals, the + symbol means a
moment suitably after the given time, for the system to become settled. The -
symbol however, means a moment suitably before the given time, satisfying the
necessary setup time.
To
reduce the clutter, be sure to fill in those signals that change state or are
updated. The following event table summarizes the behavior in the above timing
diagram. An empty entry will be interpreted to mean no-change to the
corresponding signal during the corresponding clock cycle.
6. Asynchronous and
Synchronous Output Example
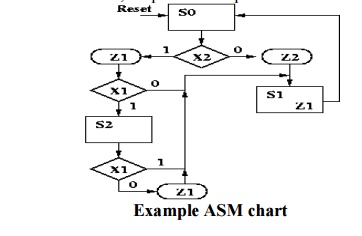
The
following is an example of an ASM chart with inputs X1 and X2, and outputs Z1
and Z2. In state S0 the outputs are immediately dependent on the input. In
state S1, output Z1 is always asserted. In state S2, output Z1 is dependent on
input X1 but Z2 is not asserted.
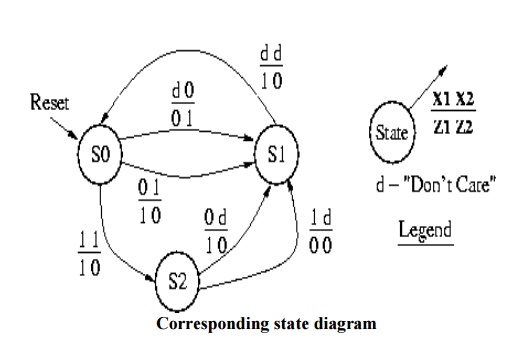
The
following is the corresponding state diagram. The legend indicates how the
input and output are associated with each arc. The 'd' symbol, which refers
here to the don't-care condition helps to reduce the clutter. While the state
diagram and ASM chart here are similar in complexity, state diagrams quickly
become messy.
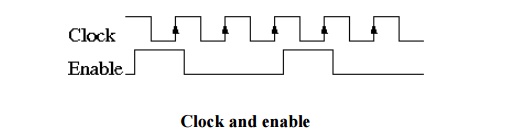
7. Clock Enable
Simply
stated, a clock enable indicates when a state machine must pay attention to the
system clock. The figure below has a clock signal and a clock enable, note that
this clock enable is asserted for one clock period at a time. The clock enable
concept is powerful as it allows a device to effectively be clocked at a rate
slower than the system clock, while remaining entirely synchronous with the
rest of the system. In this case the effective clock rate is one-third that of
the system clock.
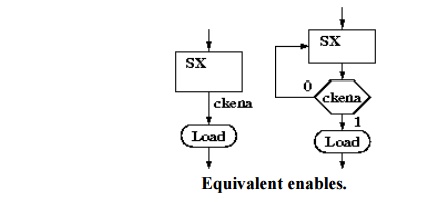
In the
spirit of reducing clutter, a clock enable can be written next to a state box.
When not asserted, the device remains in its current state. The following
figues are equivalent. Further, it is assumed that devices controlled by such a
state, as directly or indirectly enabled by the clock enable as well.
Related Topics