Chapter: Civil : Principles of Solid Mechanics : Stress-Strain Relationships (Rheology)
Yield of Ductile Materials

Yield of Ductile
Materials
Mild steel is very nearly an ideal elastic-perfectly
plastic solid for which we will use the acronym 'EPS.' A uniaxial test of an
EPS would give results as shown in Figure 3.10a as compared to a less ideal
material such as an aluminum alloy in Figure 3.10b. If the yield stress in
tension, YT , is the same as compres-sion, YC
, and there is a yield plateau, then the material is ductile and the uniaxial
yield strength is characterized by a single value, Y.
Many early yield theories were based on EPS tests.
These include:
a.
a. Max Stress Theory (Lame
-Navier-Rankine)

b.
b.
Max Strain Theory (St. Venant)

c.
c.
Max Potential Energy Theory (Beltrami)


However, these ideas
have been shown to be incorrect (or not general enough) since materials do not
yield under isotropic compression (except perhaps at extreme values). What is
actually observed in multidimensional tests is that shear causes yield.
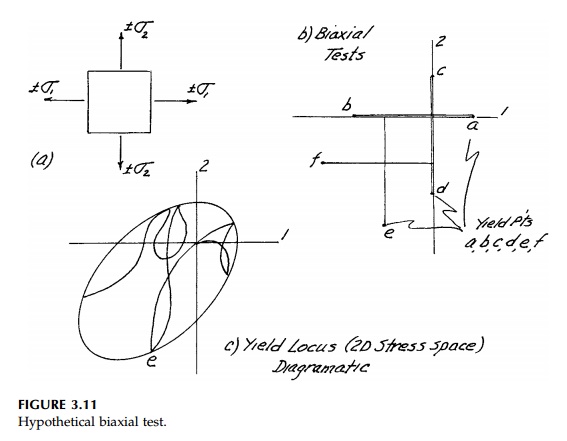
Consider first a
two-dimensional, imaginary biaxial test on a solid. Simple tension and
compression tests give points a and b in Figure 3.11b in the 1
direction and c and d in the 2 direction (this is not a block of
EPS). However, now imagine we apply some value of ![]() 1
<
YT and then increase
1
<
YT and then increase ![]() 2.
Yield might occur at point e. Doing this for various combinations of
2.
Yield might occur at point e. Doing this for various combinations of ![]() 1
and
1
and ![]() 2
we can develop a 'yield Locus' in 2D stress space (actually looking down
the 3 axis), which separates elastic from plastic behavior for this hypothetical
material. Since behavior is linear in the elastic domain, this locus will be
'independent of path' as diagrammatically indicated in Figure 3.11c.
2
we can develop a 'yield Locus' in 2D stress space (actually looking down
the 3 axis), which separates elastic from plastic behavior for this hypothetical
material. Since behavior is linear in the elastic domain, this locus will be
'independent of path' as diagrammatically indicated in Figure 3.11c.
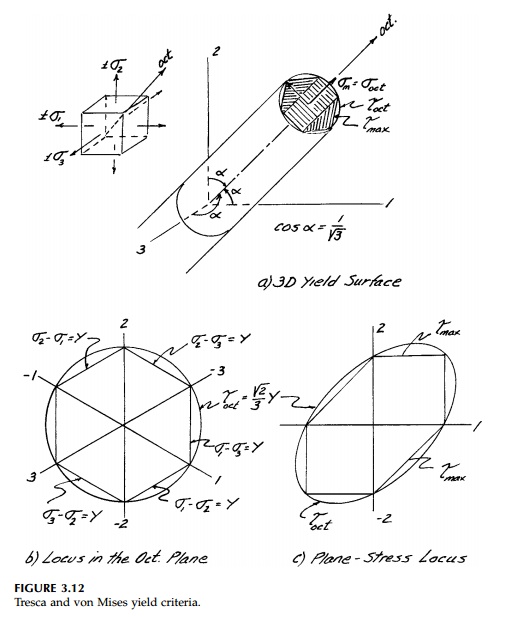
For the general,
three-dimensional situation (test), the yield locus becomes a yield surface.
Since we anticipate for our ideal EPS that the isotropic pres-sure or mean
stress will not affect yield, any point on this yield surface should be parallel to the line  which we know is the principal-space diagonal. Looking down this orientation we
would see an
octahedral plane on which a yield locus would
represent only the deviatoric component or shear at yield. Thus, as shown in
Figure 3.12a, the yield surface is a prism generated by sliding a yield locus
in the octahedral plane along the space diagonal perpendicular to it.

Two theories or yield
conditions based on test results, which are used to describe the shape and size
of this shear locus* (or cross-section of the prism) in the octahedral plane,
are compared in Figure 3.12. They are:
a)
Maximum Shear Stress Theory (Tresca)

b)Octahedral
Shear Stress Theory (Mises)

Essentially oct
is related to the root-mean-square of the principal stress differ-ences and max
concerns only the largest value.*
Using
the uniaxial test as the 'benchmark,' the maximum difference between
the two is approximately
15% and the max criterion as defined is always conservative.
Many tests have shown that, for metals, the oct criterion
is better,
but the Tresca criterion is generally used in
practice because it is conservative, easier to visualize in terms of Mohr's
Circle, and usually easier to compute.
Related Topics