Chapter: Pharmaceutical Drug Analysis: Gas Liquid Chromatography (GLC)
Working Techniques for Quantitative Analysis - Gas Liquid Chromatography (GLC)
WORKING TECHNIQUES FOR QUANTITATIVE ANALYSIS
In actual practice, the following three working techniques are not only widely popular but also
provide optimum accuracy and precision for the quantitative analysis of
pharmaceutical substances, namely :
(i) Area
Normalization,
(ii) Internal
Standard Method, and
(iii) Comparison Method.
There three techniques will be discussed briefly in the
sections that follow :
1. AREA NORMALIZATION
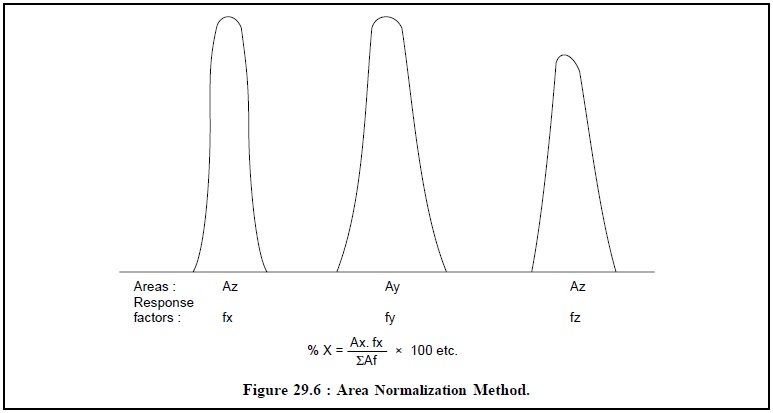
Assuming that the chromatogram is as represented in Figure
29.6, the formula employed is :

where, A = Peak area, and
f = Response factor.

Generally, different components possess different
response factors, application of which not only com-pensates for different
detector response for different components but also take into consideration the
other factors inherent with the procedure. However, these factors may be
calculated by preparing a synthetic mixture absolutely identical to what is
expected in the sample, and subsequently carrying out the gas-chromatography of
this mixture exactly under idential experimental parameters as described in the
method of analysis. Thus, we have :

where, W = Weight or conc. of component in the mixture,
and
r = A reference component
present in the mixture which is assumed to have response factor of unity.
In certain instances, like petroleum fractions, where it
may be possible to assume that most of the components possess almost equal
response factors, the area normalization formula in Eq. (f) may be further simplified to :

Salient features of Area
Normalization Method are as follows :
(i) Very
suitable for routine type of samples where the variations in composition are
only marginal i.e., in such cases
where the response factors need to be checked periodically only when necessary,
and
(ii) An
obligatory condition of this method being that all the components of the sample
should elute and be recorded.
2. INTERNAL STANDARD METHOD
In this particular method it is necessary to select a
reference compound (known as-internal
standard)
that should meet the following requirements rigidly :
(i) It is not a
component of the sample but as far as possible, is chemically identical,
(ii) It is
resolved from various components of the sample, and
(iii) It elutes
near the components of interest.
The internal standard (IS) is usually added to the sample
in such a concentration that matches favour-ably with that of components to be
evaluated. Now, the respective chromatogram is obtained by the GC-method. The
percentage of the sample is obtained by the following expression :
 .......................(i)
where, W = Weight of the sample,
w = Weight of the internal
standard,
AIS = Peak area of internal standard, and
fIS = Response factor of the internal standard.
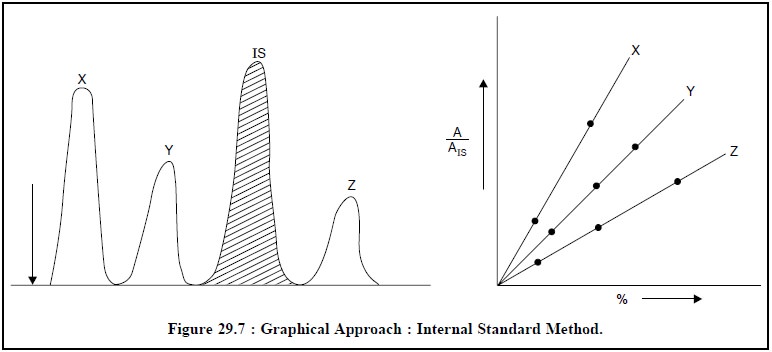
Graphical Approach : Many a times a ‘graphical approach’ as illustrated in
Figure 29.7 is also applied for the
quantitative determination of components in the sample.

First and foremost, the calibration curves are plotted
for each component by GC-method using synthetic blends (containing varying
concentrations of the component and fixed known concentration of IS) and also
plotting A/AIS Vs %-concentration. Then running separately the sample
(plus IS) in a similar manner and determining A/AIS value,
%-concentration of the component may be observed from the calibration curve.
Salient features of Internal
Standard Method-are as follows :
(i) It gives
very accurate and precise results,
(ii) It
completely eliminates possibility of error caused due to loss of some part of
the sample (other than the determined components) during the initial
preparation stage,
(iii) It
eliminates error due to incomplete elution of all the sample components, and
(iv) It
eliminates error caused due to inaccurate measurement of sample size before
injection.
3. COMPARISON METHOD
The ‘comparison
method’ makes use of a purely synthetic blend containing the component to
be determined in the same order of concentration as expected in the sample. In
fact, the very purpose of this synthetic-blends is only to simulate a typical
sample. Now, exactly equal (or known) amounts of both, the ‘synthetic blend’ and the ‘sample’are separately injected and
chromatograms obtained. Thus, by actually comparing the areas of the desired
component in both the chromatograms, the ‘unknown concentration’ may be
determined by the following expression :

where, A′X = Peak area of component X in
the chromatogram of ‘synthetic blend’.
However, this method is less accurate in comparison to
the first two methods described earlier for quantitative analysis. It should be
used judiciously if only a few components present in small concentration (i.e., < 5%) in the sample are
required to be estimated e.g., in
trace-analysis.
Precautions : Following are certain
precautions that must be observed in the quantitative analysis, namely :
(i) Detector
response should always be linear in the concentration range covered in the
analysis,
(ii) Distortion
of the peak caused due to detector and recorder performance must be as
negligible as possible,
(iii) Both
sample decomposition and adsorption in any portion of the GC-assembly must be
avoided, and
(iv) Adequate and precise sampling technique must be followed
to permit injection of representative sample only. Obviously, this part of
analyis is as vital and critical as the gas chromatorgraphic part of analysis.
Related Topics