Chapter: Software Architectures : Documenting the Architecture
Visual Language Representation
Visual Language Representation
What is a VPL?
• A
programming language that uses a visual representation (such as graphics,
drawings, animation or icons, partially or completely)
• A
visual language manipulates visual information or supports visual interaction,
or allows programming with visual expressions [Golin 90]
• Any
system where the user writes a program using two or more dimensions [Myers 90]
• A
visual language is a set of spatial arrangements of text-graphic symbols with a
semantic interpretation that is used in carrying out communication actions in
the world
What are NOT VPLs?
• Visual
Basic, Visual C++, Delphi, etc.
– Still
primarily textual languages with a graphical GUI builder
– User
interface portion of the language is visual, the rest is not
Motivations
• Many
people think in pictures.
• Textual
programming languages have proven to be difficult for many people to learn to
use effectively.
• Some
applications are very well suited to graphical development approaches.
– Scientific
visualization
– System
simulation
Motivations
• Many
people think in pictures.
• Textual
programming languages have proven to be difficult for many people to learn to
use effectively.
• Some
applications are very well suited to graphical development approaches.
– Scientific
visualization
– System
simulation
Example 1: Factorial
int Factorial(int n)
{
if(n > 0)
return (n*factorial(n-1));
else
return (1);
}
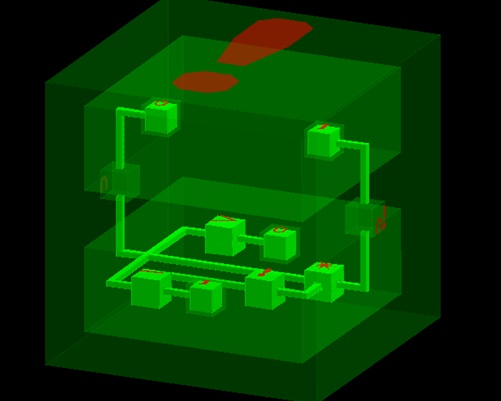
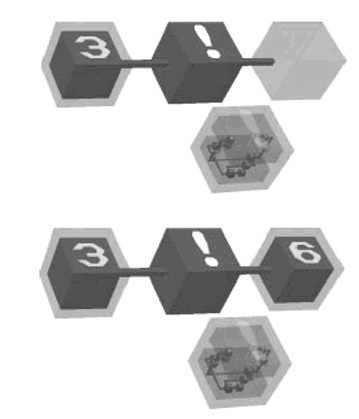
Classifications
1. Purely
visual languages
•
Icons or other graphical representations
are manipulated
e.g. Cube, VIPR, Prograph, …
2. Hybrid
text and visual systems
•
Programs are created visually and then
translated into an underlying textual language
•
Usage of graphical elements in an
otherwise textual language
e.g. Rehearsal World
3. Programming-by-example
systems
•
Teach a system how to perform a task
e.g. Rehearsal World,
Pygmalion
4. Constraint-oriented
systems
•
Popular for simulation design
e.g. ThingLab, ARK
5. Form-based
systems
•
Uses a spreadsheet metaphor
e.g. Forms/3, NoPumpG
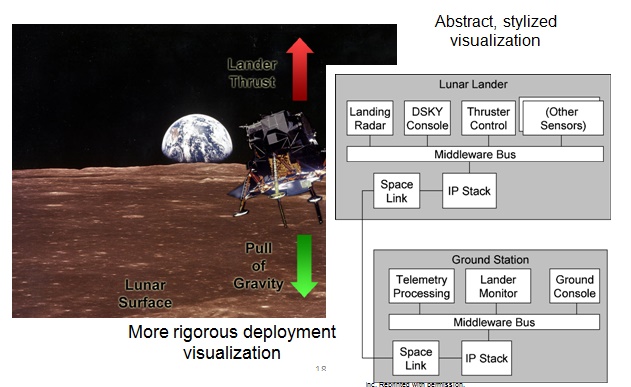
What is
Architectural Visualization?
• Recall
that we have characterized architecture as the set of principal design
decisions made about a system
• Recall
also that models are artifacts that capture some or all of the design decisions
that comprise an architecture
• An
architectural visualization defines how architectural models are
depicted, and how stakeholders interact with those depictions
– Two
key aspects here:
• Depiction
is
a picture or other visual representation of design decisions
• Interaction
mechanisms allow stakeholders to interact with design decisions in terms of the
depiction
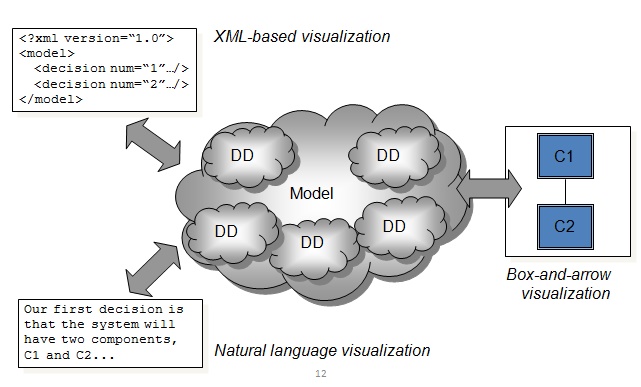
Models vs.
Visualizations
• It
is easy to confuse models and visualizations because they are very closely
related
• In
the previous lectures, we have not drawn out this distinction, but now we make
it explicit
• A
model is just abstract information – a set of design decisions
• Visualizations
give those design decisions form: they let us depict those design
decisions and interact with them in different ways
– Because
of the interaction aspect, visualizations are often active – they are both
pictures AND tools
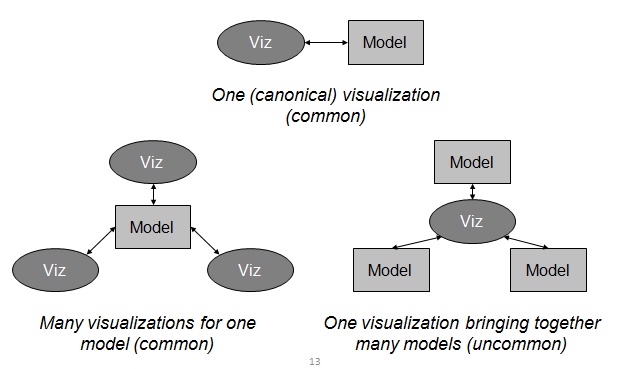
Different
Relationships
Kinds of
Visualizations: Textual Visualizations
• Depict
architectures through ordinary text files
– Generally
conform to some syntactic format, like programs conform to a language
– May
be natural language, in which case the format is defined by the spelling and
grammar rules of the language
– Decorative
options
• Fonts,
colors, bold/italics
• Tables,
bulleted lists/outlines
Textual
Visualizations: Interaction
• Generally
through an ordinary text editor or word processor
• Some
advanced mechanisms available
– Syntax
highlighting
– Static
checking
– Autocomplete
– Structural
folding
Textual Visualizations
• Advantages
– Depict
entire architecture in a single file
– Good
for linear or hierarchical structures
– Hundreds
of available editors
– Substantial
tool support if syntax is rigorous (e.g., defined in something like BNF)
• Disadvantages
– Can
be overwhelming
– Bad
for graphlike organizations of information
– Difficult
to reorganize information meaningfully
– Learning
curve for syntax/semantics
Kinds of
Visualizations: Graphical Visualizations
• Depict
architectures (primarily) as graphical symbols
– Boxes,
shapes, pictures, clip-art
– Lines,
arrows, other connectors
– Photographic
images
– Regions,
shading
– 2D
or 3D
• Generally
conform to a symbolic syntax
– But
may also be ‘free-form’ and stylistic
Graphical
Visualizations
Graphical
Visualizations: Interaction
• Generally
graphical editors with point-and-click interfaces
– Employ
metaphors like scrolling, zooming, ‘drill-down’
• Editors
have varying levels of awareness for different target notations
– For
example, you can develop UML models in PowerPoint (or Photoshop), but the tools
won’t help much
• More
exotic editors and interaction mechanisms exist in research
– 3D
editors
– “Sketching-based”
editors
Graphical
Visualizations
• Advantages
– Symbols,
colors, and visual decorations more easily parsed by humans than structured
text
– Handle
non-hierarchical relationships well
– Diverse
spatial interaction metaphors (scrolling, zooming) allow intuitive navigation
• Disadvantages
– Cost
of building and maintaining tool support
• Difficult
to incorporate new semantics into existing tools
– Do
not scale as well as text to very large models
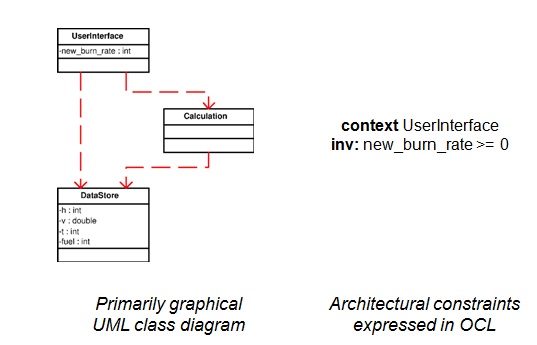
Hybrid
Visualizations
• Many
visualizations are text-only
• Few
graphical notations are purely symbolic
– Text
labels, at a minimum
– Annotations
are generally textual as well
• Some
notations incorporate substantial parts that are mostly graphical alongside
substantial parts that are mostly or wholly textual
Views,
Viewpoints, & Visualizations
• Recall
that a view is a subset of the design decisions in an architecture
• And
a viewpoint is the perspective from which a view is taken (i.e., the
filter that selects the subset)
• Visualizations
are associated with viewpoints
Advantages
• Fewer
programming concepts
• Concreteness
• Explicit
depiction of relationships
• Immediate
visual feedback
• Eliminates
an intermediate step in the process of creating a program
Disadvantages
• Deutsch
Limit
• The
problem with visual programming is that you can't have more than 50 visual
primitives on the screen at the same time.
• Some
situations in which text has superiority:
• documentation,
• naming
to distinguish between elements that are of the same kind, and
• expressing
well-known and compact concepts that are inherently textual, e.g. algebraic
formulas.
Related Topics