Chapter: Modern Analytical Chemistry: Developing a Standard Method
Verifying the Method
Verifying the Method
After developing and optimizing a method, it is necessary
to determine the quality
of results that can reasonably be expected when
the method is used by a single
ana- lyst. Generally, three steps are included in the process
of verifying a method: deter- mining single-operator characteristics, the blind analysis
of standards, and deter-
mining the method’s ruggedness. In addition, if an alternative standard method exists,
both the standard
method and the new method
can be used to analyze
the same sample, and
the results compared. If the quality
of the results
is unacceptable, the method
is not suitable for consideration as a standard
method.
Single-Operator Characteristics
The first step in verifying a method is to determine the precision, accuracy, and de- tection limit
when a single analyst uses the method
to analyze a standard sample
of known composition. The detection limit,
which was discussed, is de- termined by analyzing a reagent blank
for each type of sample
matrix for which
the method will be used. Precision is determined by analyzing replicate portions,
preferably more than ten, of a standard
sample. Finding the method’s accuracy
is evaluated by a t-test.
Precision and accuracy
should be evaluated for several different concentration levels of analyte, including at least one concentration near the detection
limit, and for each type of sample matrix that will
be encountered. The analysis of several concentrations allows for the detection of constant sources of determinate error and establishes the range of concentrations
for which the method is applicable.
Blind Analysis of Standard Samples
Single-operator characteristics are determined by analyzing a sample whose
concen- tration of analyte
is known to the analyst. The second step
in verifying a method is the blind analysis of standard samples where the analyte’s
concentration remains unknown to the analyst. The standard sample
is analyzed several
times, and the
av- erage concentration of the analyte
is determined. This value should
be within three, and preferably two standard deviations (as determined from the single-operator characteristics) of the analyte’s known
concentration.
Ruggedness Testing
In many cases
an optimized method
may produce excellent results in the laboratory
developing the method,
but poor results
in other laboratories. This is not
surprising since a method
is often optimized by a single
analyst under an ideal set
of condi- tions, in which the
sources of reagents, equipment, and instrumentation remain the same for each trial. The procedure
might also be influenced by environmental fac- tors, such as the
temperature or relative humidity in the
laboratory, whose levels
are not specified in the procedure and which may differ between
laboratories. Finally, when optimizing a method the analyst usually
takes particular care to perform
the analysis in exactly
the same way during every trial.
An important step in developing a standard method
is to determine which fac- tors have a pronounced effect on the quality of the analytical method’s result. The procedure can then be written to specify the degree to which these
factors must be controlled. A procedure that,
when carefully followed, produces high-quality results in different laboratories is considered rugged.
The method by which the critical fac- tors are discovered is called ruggedness testing.
Ruggedness testing is often performed by the laboratory
developing the stan- dard method.
Potential factors are
identified and their
effects evaluated by perform-
ing the analysis while the
factors are held
at two levels.
Normally one level
for each factor is that given
in the procedure, and the other is a level
likely to be encountered
when the procedure is used by other
laboratories.
This approach to ruggedness testing can be time-consuming. If
seven poten- tial factors are identified, for example, ruggedness testing can be accomplished with a 27 factorial design. This requires
a total of 128 trials,
which is a prohibitively
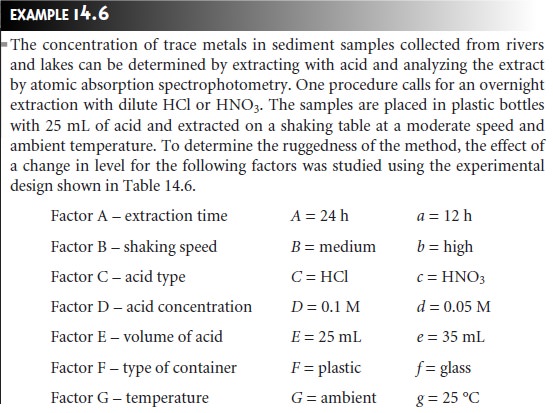
large amount of work. A simpler experimental design is shown in Table 14.6, in which
the two factor
levels are identified by upper case and lower
case letters. This design,
which is similar
to that for the 23 factorial design discussed in the previous section, is called
a fractional factorial design and provides information about the first-order effect of each
factor. It does
not, however, provide
suffi- cient information to evaluate higher
order effects or potential interactions be- tween factors, both of which are assumed to be of less importance
than first- order effects.
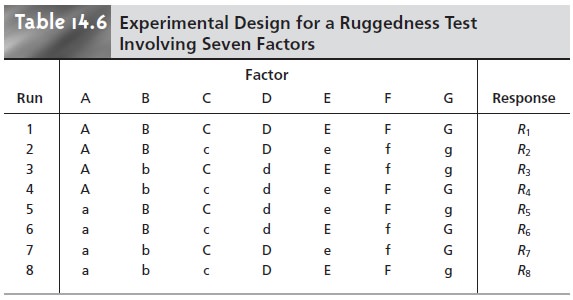
The experimental design for ruggedness testing is balanced in that each factor level is paired an equal number of times with the upper case and lower case levels for every other factor. The effect of changing the level for any one factor, Ef, is de- termined by subtracting the average response when the factor is at its upper case level from the average value when it is at its lower case level
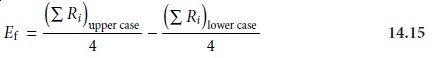
Because
the design
is balanced, the levels for
the remaining factors
appear an equal number
of times in both summation terms, and, consequently, their effect on the response is canceled. For example, the effect of changing the level for fac-
tor A is determined by averaging the
responses from runs
1 through 4 and sub- tracting the average response
from runs 5 through 8. Factor B does not affect Ef
because its upper case levels
in runs 1 and 2 are canceled
by the upper case levels in runs 5 and 6, and its lower
case levels in runs 3 and 4 are canceled
by the lower case levels in runs 7 and 8. Similar reasoning shows that the remaining factors
are also canceled.
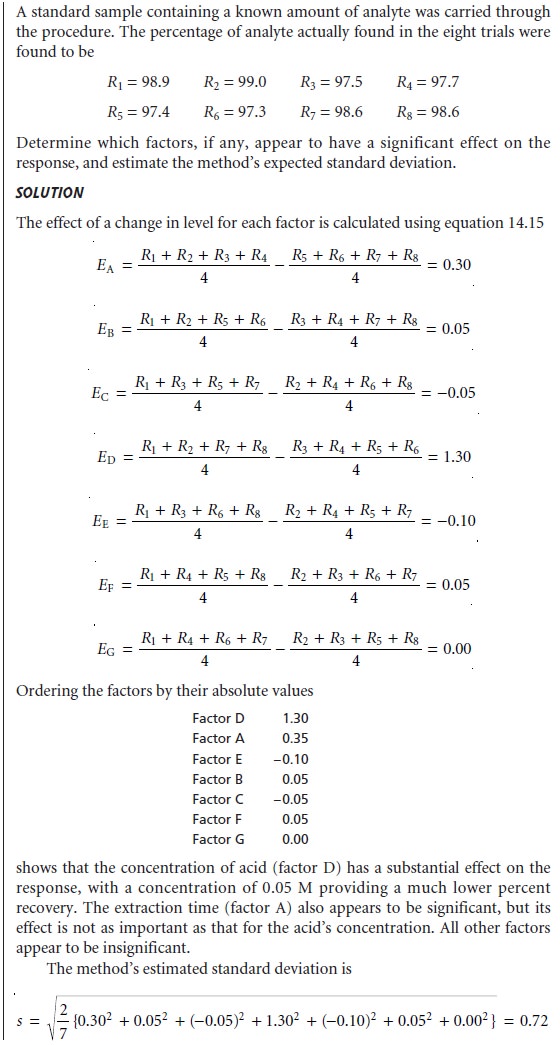
After each of the effects
is calculated, they are ranked
from largest to smallest,
without regard to sign, and those factors
whose effects are substantially larger
than the other factors
are identified. The estimated standard
deviation for the analysis is given
by
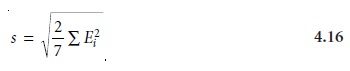
This provides the best estimate
of the expected standard deviation for results ob- tained by several laboratories, due to the effects of small changes
in uncontrolled or poorly controlled factors. If this standard
deviation is unacceptably large, then the procedure may be modified
to bring under
greater control those
factors whose lev- els
have the greatest
effect on the response.
Equivalency Testing
If a standard method is available, the performance of a new
method can be evalu-
ated by comparing results with those obtained
with an approved standard method. The comparison should be done at a minimum
of three concentrations to evaluate the applicability of the new method for different amounts
of analyte. Alternatively, we can plot the
results obtained by the new
method against those
obtained by the approved standard method. A linear regression analysis should give
a slope of 1 and a
y-intercept of 0 if the results
of the two methods are equivalent.
Related Topics