Chapter: Pharmaceutical Drug Analysis: Errors In Pharmaceutical Analysis and Statistical Validation
Statistical Treatment of Finite Samples
STATISTICAL TREATMENT OF FINITE SAMPLES
The various techniques by which one may effectively treat
the scientific data normally obtained in actual analytical procedures are
enumerated below :
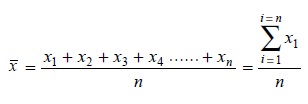
1. Mean
It is the average of a series of results. The mean of a
finite number of measurements, xl,
x2, x3, x4,
........, xn, is commonly
represented as x’. It may be
calculated by taking the average of individual results as ![]() shown below :
shown below :
It is evident that the mean of n results is √n times more reliable than any
one of the individual results. Therefore,
there exists a diminishing return from accumulating more and more replicate
meaurements. In other words, the mean of 9 results is 3 times as reliable as 1
result in measuring central tendency (i.e.,
the value about which the individual results tend to cluster) ; the mean of 16
results is 4 times as reliable etc.
2. Median
The median of an even number of results is nothing but
the average of the ‘two middle values’ pro-vided the results are listed in
order ; whereas for an odd number of results the median is the ‘middle value’
itself. However, the ‘mean’ and the ‘median’ are exactly identical in the
case of a truly symmetrical distribu-tion. In short, median is an useful
measure specifically when dealing with very small samples.
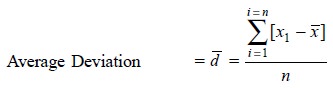
3. Average Deviation (or Mean Deviation)
It is the average of the differences between the
individual results and the mean. It is regarded as a measure of variability. In
the case of a small number of observations the average deviation is found to be
not quite significant statistically. The average or mean distribution may be
calculated by adopting the following steps, namely :
(i) To find the
differences between individual results and the mean, without considering the
+ve or –ve sign,
(ii) To add
these individual deviations, and
(iii) To divide
by the number of results (i.e., n).
Hence, an ‘average deviation’ may be expressed as :
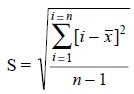
4. Standard Deviation
It is the distance from the mean to the point of
inflexion of the normal distribution curve. In compari-son to the average
deviation the ‘standard deviation’
is usually considered to be much more useful and meaningful statistically. For
a finite number of values it is normally symbolised as ‘S’, and may be
expressed as follows :
In a situation, where ‘n’ is fairly large, say to the extent of 50 or more, it hardly
matters whether the denominator in the above expression is either n – 1 or n; however, the former (i.e.,
n – 1) is strictly correct.
5. Coefficient of Variation (ν)
The coefficient of variation (ν)
is simply the standard deviation(s) expressed as a percentage of the mean ( x’ ) as stated below :

6. Variance (s2)
The variance is the square of the standard deviation(s) i.e., s2. However, the former is fundamentally more important
in statistics than the latter, whereas the latter is employed more frequently
in the treatment of chemical data.
7. Calculations of Fundamental Statistical Parameters
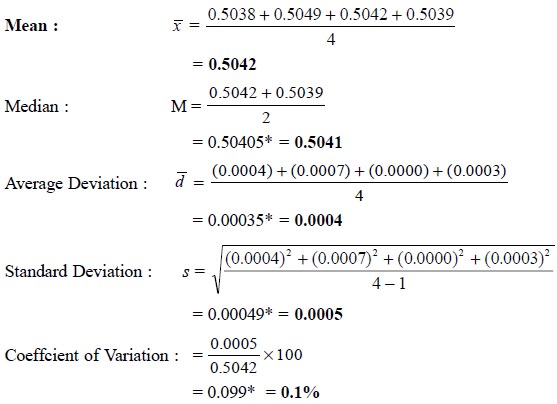
Example : The normality of a solution of
sodium hydroxide as determined by an ‘analyst’ by FOUR different titrations are
found to be 0.5038 ; 0.5049 ; 0.5042 ; and 0.5039. Calculate the mean, median,
average deviation, standard deviation and coefficient of variation.
Related Topics