Chapter: Pharmaceutical Drug Analysis: Errors In Pharmaceutical Analysis and Statistical Validation
Distribution of Random Numbers
DISTRIBUTION OF RANDOM NUMBERS
Results obtained from a given set of measurements that
scatter in a random manner are adequately treated by most logical methods of
statistics.
In a situation whereby a large number of replicate
readings, not less than 50, are observed of a titrimetric equivalence point
(continuous variable), the results thus generated shall normally be distributed
around the mean in a more or less symmetrical fashion. Thus, the mathematical
model which not only fits into but also satisfies such a distribution of random
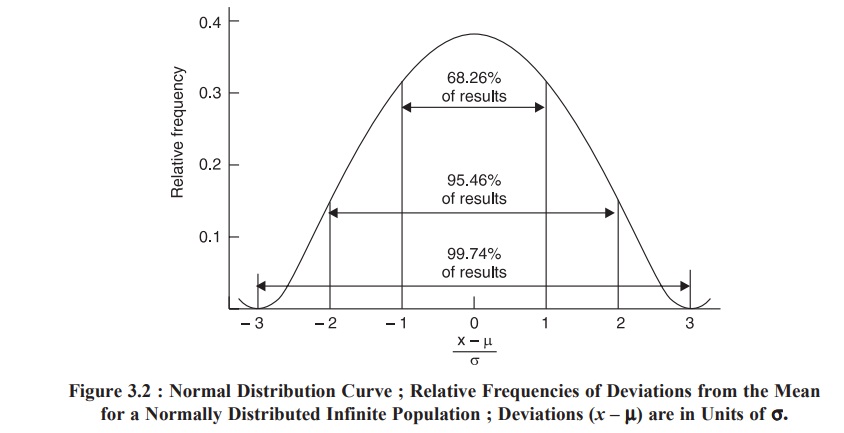
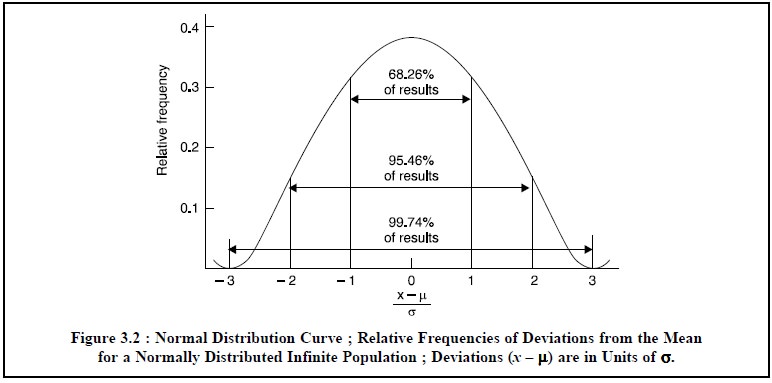
errors is termed as the Normal or Gaussian distribution curve. It is a
bell-shaped curve which is noted to be symmetrical about the mean as depicted
in Figure 3.2.
The equation of the normal curve may be expressed as given
below :
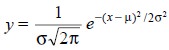
where, y = Relative frequency
with which random sampling of the infinite population shall bring forth a specific value x,
σ= Standard deviation, and
μ= Mean.
From the Normal distribution curve (Figure 3.2) it may be observed that 68.26% of results shall fall within one standard deviation on either side of the mean, 95.46% shall fall within two standard deviations, and 99.74% within three standard deviations.
Related Topics