Chapter: Pharmaceutical Drug Analysis: Errors In Pharmaceutical Analysis and Statistical Validation
Classification of Errors in Pharmaceutical Analysis
CLASSIFICATION OF ERRORS
The numerous uncertainties usually encountered in a
chemical analysis give rise to a host of ‘errors’ that may be broadly categorised
into two heads, namely :
(i) Determinate
(systematic) Errors, and
(ii)
Indeterminate (random) Errors.
It is pertinent to mention here that it becomes rather
difficult at times to place a particular ‘error’ into one of the above
mentioned categories ; however, the classification may prove to be beneficial
with regard to study of the various analytical errors that crop up in the
course of routine analysis.
1. DETERMINATE (SYSTEMATIC) ERRORS
These are errors that possess a definite value together
with a reasonable assignable cause; however, in principle these avoidable
errors may be measured and accounted for coveniently. The most important errors
belonging to this particular class are :
(a) Personal Errors : They are exclusively
caused due to ‘personal equation’ of an analyst and have no bearing whatsoever
either on the prescribed procedure or methodology involved.
(b) Instrumental Errors : These are
invariably caused due to faulty and uncalibrated instruments, such as : pH
meters, single pan electric balances, uv-spectrophotometers, potentiometers
etc.
(c) Reagent Errors : The errors that are
solely introduced by virtue of the individual reagents, for instance :
impurities inherently present in reagents ; high temperature volatalization of
platinum (Pt) ; unwanted introduction of ‘foreign substances’ caused by the
action of reagents on either porcelain or glass apparatus.
(d) Constant Errors : They are observed to
be rather independent of the magnitude of the measured amount ; and turn out to
be relatively less significant as the magnitude enhances.
Example : Assuming a constant
equivalence—point error of 0.10 ml is introduced in a series of titrations,
hence for a specific titration needing only 10.0 ml of titrant shall represent
a relative error of 1% and only 0.2% for a corresponding 50 ml of titrant
consumed.
(e) Proportional Errors : The absolute
value of this kind of error changes with the size of the sample in such a
fashion that the relative error remains constant. It is usually incorporated by
a material that directly interferes in an analytical procedure.
Example : Estimation of ‘chlorate’—an
oxidant by iodometric determination. In this particular instance two things may happen, namely :
(i) Presence of
‘Bromate’—another oxidizing agent would give rise to positively higher results,
and hence, it must be duly corrected for, and
(ii) Absolute
error might increase while dealing with large samples, whereas the relative
error would remain more or less constant if the sample is perfectly homogenous,
(f) Errors due to Methodology : Both
improper (incorrect) sampling and incompleteness of a reaction often lead to
serious errors. A few typical examples invariably encountered in titrimetric
and gravimetric analysis are cited below :
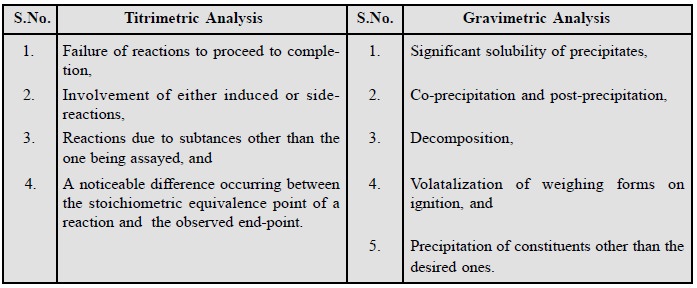
(g) Additive Errors : It has been observed
that the additive errors are independent of the quantum of the substances
actually present in the assay.
Examples : (i) Errors caused due to weights, and
(ii) Loss in
weight of a crucible in which a precipitate is incenerated.
Detection of this error is ascertained by taking samples
of different weights.
2. INDETERMINATE (RANDOM) ERRORS
As the name suggests, indeterminate errors cannot be
pin-pointed to any specific well-defined reasons. They are usually manifested
due to the minute variations which take place inadvertently in several
successive measurements performed by the same analyst, using utmost care, under
almost identical experimental parameters. These errors are mostly random in
nature and ultimately give rise to high as well as low results with equal
probability. They can neither be corrected nor eliminated, and therefore, form
the ‘ultimate limitation’ on the specific measurements. It has been observed that
by performing repeated measurement of the
same variable, the subsequent statistical treatment of the results would have a
positive impact of ‘reducing their importance’ to a considerable
extent.
Example : Figure 3.1, represents the
absolute errors in nitrogen analysis by means of micro Kjeldahl’s Method*. Here, each vertical line
labelled ( x’1 – xt)
designates the absolute deviation of the mean of the set from the true value. In Figure 3.1, A represents ( x’1 – xt) the absolute error obtained by ‘analyst-1’ for the assay of benzyl-iso-thioureahydrochloride,
whereas B represents ( x’2
– xt) the absolute error
obtained by ‘analyst-2’ for the
assay of the same compound.
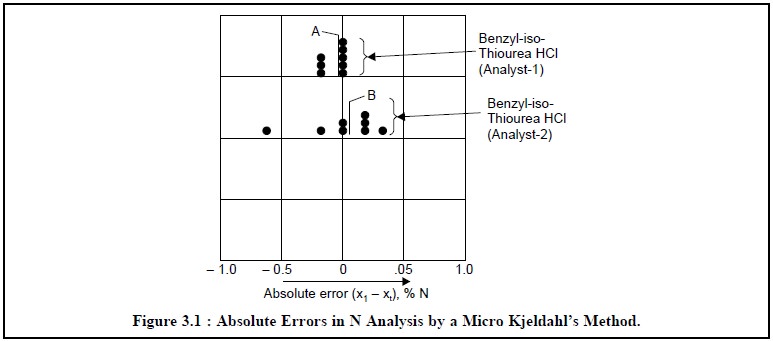
Thus, it is evident from Figure 3.1, that the broad
spread of individual errors centres around the mean values (x’n – x ) thereby affording a direct indication of indeterminate type
uncertainties. Hence, larger indeterminate errors seem to be linked with the
performance of ‘analyst-2’ than with
that of ‘analyst-1’.
![]()
Salient Features of Indeterminate Errors
The various salient features of indeterminate errors are
enumerated below :
1)
Repeated mesurement of the same variable several times
and subsequent refinement to the extent where it is simply a coincidence if the
corresponding replicates eventually agree to the last digit,
2)
Both unpredictable and imperceptible factors are
unavoidably incorporated in the results what generally appear to be ‘random fluctuations’ in the measured
quantity,
3)
Recognition of specific definite variables which are
beyond anyone’s control lying very close to the performance limit of an
instrument, such as : temperature variations, noise as well as drift from an
electronic circuit, and vibrations caused to a building by heavy
vehicular-traffic,
4)
A variation that may be regarded as random by a slipshod
analyst may at the same time prove to be quite evident and manageable by a
careful observer, and
5)
The average of a number of fine observations having
random scatter is definitely more accurate, precise and, hence, more cogent than
coarse data that appear to agree perfectly.
3. ACCURACY
In connexion with the scientific data the two
terminologies ‘accuracy’ and ‘precision’ are invariably practised
synonymously, but there exists a clear distinction between them as discussed
below :
In usual practice an accurate result is the one which
matches very nearly with true value of a measured amount. The comparison is
normally done with regard to the ‘error’;
and the accuracy is inversely propor-tional to it i.e., the greater the accuracy, the smaller is the error. ‘Absolute error’ is the difference
between the experimental value and
the true value.
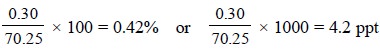
Example : An analyst determines a value
of 70.55% cineole in a fresh sample of Eucalyptus Oil that actually contains
70.25%, the absolute error is given by :
70.55 – 70.25 = 0.30%
The error thus obtained is invariably stated with regard
to the actual size of the measured quantity i.e.,
either in percent (%) or in parts per thousand (ppt). Therefore, the relative
error is given by :
4. PRECISION
It may be defined as—‘the
agreement amongst a cluster of experimental results ; however, it does not imply anything with respect to their
relation to the ‘true value’ ’. Precision designates ‘reproducibility’ of a measurement, whereas accuracy the
correctness of a measurement. Precision invariably forms an integral part of
accuracy, but ironically a high degree of precision may not necessarily suggest
accuracy.
Example : A sample of pure Peppermint
Oil is known to contain 30.10 ± 0.03 per cent of Menthone. The results obtained by
two Analysts-1 and 2 employing the same sample of peppermint oil and making use
of the same analytical reagents and procedure are as stated below :

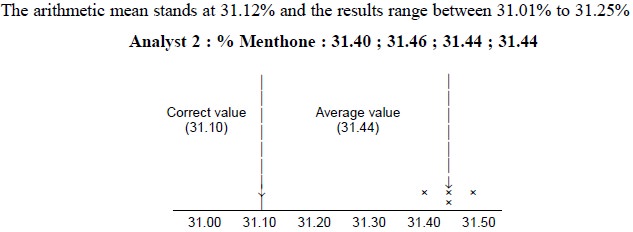
The arithmetic mean is 31.44% and the results vary
between 31.40% to 31.46%
The ultimate results of the analysis put forward by the
Analysts-1 and 2 may be summarized as under :
(i) The results
achieved by Analyst-1 are fairly accurate i.e.,
in close proximity to the correct result ; however, the precision stands at an
inferior level to the results obtained by Analyst-2. The results accomplished
by Analyst-2 are indeed extremely precise but fail in accuracy,
(ii) The
results of Analyst-1 lie on either sides of the average value as shown by two
‘cross-signs’ on each side which might have been caused due to ‘random errors’
discussed earlier. It is quite evi-dent that there exists a constant
(determinate) error in the results obtained by the Analyst-2, and
(iii) In case,
Analyst-3 had performed the estimations on the very same day in quick
succession i.e., one after the other,
this type of analysis could be termed as ‘repeatable analysis’. If the
estimations had been carried out on two separate days altogether, thereby
facing different laboratory conditions then the results so obtained would be
known as ‘reproducible analysis’.
In short, there exists a marked and pronounced
distinction between a within-run precision (i.e.,
repeatability) and an in-between-run
precision (i.e., reproducibility).
5. MINIMISING SYSTEMATIC ERRORS
Systematic errors may be reduced substantially and
significantly by adopting one of the following procedures rigidly, such as :
(i) Calibration of Instruments, Apparatus and
Applying Necessary Corections
Most of the instruments, commonly used in an analytical
laboratory, such as : UV-Spectrophoto-meter, IR-Spectrophotometer, single—pan
electric balance, pH-meter, turbidimeter and nephelometer, polarimeter,
refractometer and the like must be calibrated duly, before use so as to
eliminate any possible errors. In the same manner all apparatus, namely :
pipettes, burettes, volu-metric flasks, thermometers, weights etc., must be
calibrated duly, and the necessary corrections incorporated to the original
measurements
In some specific instances where an error just cannot be
avoided it may be convenient to enforce an appropriate correction for the
effect that it ultimately causes ; for instance : the inherent impu-rity
present in a weighed precipitate can be estimated first and then deducted duly
from its weight.
(ii) Performing a Parallel Control Determination
It essentially comprises of performing an altogether
separate estimation under almost identical experimental parameters with a
quantity of a standard substance that consists of exactly the same weight of
the component as is present in the unknown sample. Thus, the weight of the
component present in the unknown sample may be calculated with the help of the
following expression :

where, X = Weight of the component present in the Unknown
Sample.
Note : A good number of
Standard Samples, including primary standards, such as : arsenic trioxide,
benzoic acid, potassium hydrogen phthalate, sodium oxalate, are available as :
BPCRS = British Pharmacopoeia
Chemical Reference Substance,
EPCRS = European Pharmacopoeia
Chemical Reference Substance,
CRM = BCS—Certified Reference
Materials,
ECRM = EURONORM—Certified
Reference Materials.
(iii) Blank Determination :
In order to ascertain the effect of the impurities
present in the reagents employed and reaction vessels used ; besides
establishing exactly the extent to which an excess of standard solution
required to locate the exact end-point under the prevailing experimental
parameters of the unknown sample—a blank determination is an absolute
necessity. It may be accomplished by performing a separate parallel estimation,
without using the sample at all, and under identical experimental parmeters as
employed in the actual analysis of the given sample.
Note : Always avoid using an
appreciably large blank correction which gives rise to a vague and uncertain
‘exact value’ thereby minimising the precision of the analysis.
(iv) Cross-checking Results by Different Methods
of Analysis
In certain specific cases tha accuracy of a result may be
cross-checked by performing another analysis of the same substance by an
altogether radically different method.
Examples :
(a) HCl-Solution : It may be assayed either
by titration with a standard solution of a strong alkali (NaOH), or by
precipitation and weighing as AgCl ; and
(b) Fe3+ : It may be assayed
either by gravimetric method as Fe(III) hydroxide after getting rid of the
interfering elements and igniting the precipitate to Fe(III) oxide, or by
titrimetric method i.e., first
reducing to the Fe(II) state and then titrating with a suitable oxidizing
agent, for instance Ce(IV) sulphate,
K2Cr2O7. In short, the results thus obtained
by the two fundamen-tally different techniques must be concordant thereby
justifying and ascertaining the fact that the values obtained are fairly small
limits of error.
(v) Method of Standard Addition
Here, a small known quantity of the component under
estimation is added to the sample, which is subsequently subjected to analysis
for the total amount of component present. The actual differ-ence in the
quantity of components present in samples with or without the added component
ultimately gives the recovery of the quantum added component. A good
satisfactory recovery builds up the confidence in the accuracy of the method of
analysis.
Note : The method of ‘standard
addition’ is particularly useful to physicochemical techniques
of analysis, for instance :
spectrophotometry, turbidimetry.
(vi) Method of Internal Standards
The specific method is of immense value both in
chromatographic as well as spectroscopic determinations. Here, a fixed quantity
of a reference substance (i.e., the
‘internal standard’) is added to a series of known concentrations of the
material to be assayed.
A graph is plotted between the concentration values and
the ratios obtained from the physical value (i.e., peak area of absorption) of the ‘internal standard’ and the series of known concentra-tions,
thereby producing a straight line. Any unknown concentration may be determined
effec-tively by adding the same amount of ‘internal
standard’ and locating exactly where the ratio obtained falls on the
concentration scale.
Related Topics