Chapter: Genetics and Molecular Biology: Nucleic Acid and Chromosome Structure
Measurement of Helical Pitch
Measurement of Helical Pitch
It is not straightforward to determine the
helical repeat of DNA under in vivo conditions.
Such measurements have been made, and will bedescribed later. Here we shall
consider measuring the helical pitch invitro
of linear DNA not bound to any proteins.
Klug and
co-workers found that DNA can bind tightly to the flat surface of mica or
calcium phosphate crystals. While bound to such surfaces, only a portion of the
cylindrical DNA is susceptible to cleavage by DNAse I, an enzyme that
hydrolyzes the phosphodiester backbone of DNA (Fig. 2.8). Consider the
consequences of: 1. utilizing an homoge-nous population of DNA molecules, 2.
radioactively labeling each mole-cule on one end with 32PO4,
3. rotationally orientating all the DNA molecules similarly, i.e. the 5’ end of
the labeled strand begins in contact with the solid support, 4. performing a
partial digestion with DNAse I, so that on average, each DNA molecule is
cleaved only once.
In the
population, the labeled strand will be cleaved more frequently at those
positions where it is on the part of the helix up away from the support, and
thus cleavages will be concentrated at positions 1⁄2, 11⁄2, 21⁄2 etc. helical turns from the
labeled end. A similar population of labeled DNA digested while in solution
will possess some molecules
Figure
2.8 Determination of the helical
pitch of DNA while bound to a solidsupport. While bound to the support, and
while free in solution, the DNA is lightly digested with DNAse, the denatured
fragments are separated according to size by electrophoresis and an
autoradiograph is made of the gel. When the DNA is on the solid support, DNAse
has only limited access.
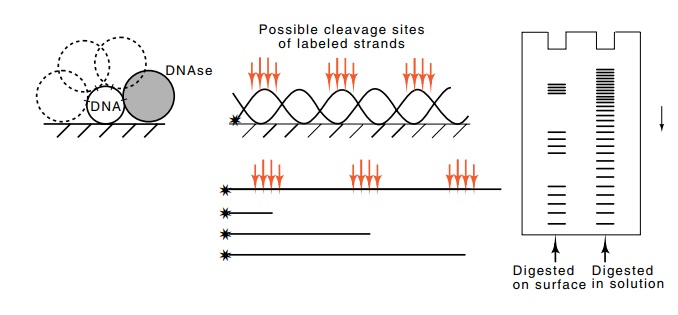
cleaved at every position. Electrophoretic
separation of the populations yields the pattern shown (Fig. 2.8). In the
sample cleaved while on the flat support most cleavages, and hence the darkest
bands, are separated by 10 or 11 base pairs. The DNA cleaved in solution shows
all sizes of DNA fragments.
Related Topics