Chapter: Operations Research: An Introduction : Modeling with Linear Programming
Graphical LP Solution: Solution of a Maximization Model
GRAPHICAL
LP SOLUTION
The
graphical procedure includes two steps:
1. Determination of the feasible solution space.
2. Determination of the optimum solution from among
all the feasible points in the solution space.
The
procedure uses two examples to show how maximization and minimization objective
functions are handled.
Example
2.2-1
This
example solves the Reddy Mikks model of Example 2.1-1.
Step 1.Determination
ofthe Feasible Solution Space:
First, we
account for the nonnegativity constraints x1>= 0 and x2>=0. In Figure
2.1, the horizontal axis x1 and the vertical axis x2 represent
the exterior- and interior-paint variables, respectively. Thus, the nonnegativity
of the variables restricts the solution-space area to the first quadrant that
lies above the xl-axis and to the right of the x2- axis.
To
account for the remaining four constraints, first replace each inequality with
an equation and then graph the resulting straight line by locating two distinct
points on it. For example, after replacing 6x1 + 4x2 = 24 with the straight line 6x1
+ 4x2
= 24, we
can determine two distinct points by first setting x1 = 0 to obtain x2 = 24/4= 6 and then setting x2 = 0 to obtain
x1 = 24/6 = 4. Thus, the line passes through the two points (0,6)
and (4,0), as shown by line (1) in Figure 2.1.
Next,
consider the effect of the inequality. All it does is divide the (x1, x2)-plane
into two half-spaces, one on each side of the graphed line. Only one of these
two halves satisfies the inequality. To determine the correct side, choose
(0,0) as a reference point. If it
satisfies the inequality, then the side in which it lies is the
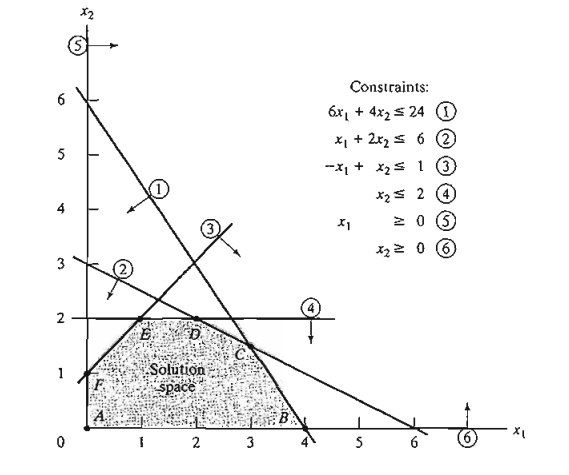
FIGURE 2.1
Feasible
space of the Reddy Mikks model
feasible
half-space, otherwise the other side is. The use of the reference point (0,0)
is illustrated with the constraint 6x1 + 4x2
<= 24. Because 6 x 0 + 4 x 0 =
0 is less than 24, the half-space representing the inequality includes the
origin (as shown by the arrow in Figure 2.1).
It is
convenient computationally to select (0,0) as the reference point, unless the
line happens to pass through the origin, in which case any other point can be
used. For example, if we use the reference point (6,0), the left-hand side of the first con-straint is 6 X 6 + 4 X 0 = 36,
which is larger than its right-hand side (= 24),
which means that the side in which (6,0) lies is not feasible for the
inequality 6X1 + 4X2 =< 24. The
conclusion is consistent with the one based on the reference point
(0,0).
Application
of the reference-point procedure to all the constraints of the model produces
the constraints shown in Figure 2.1 (verify!). The feasible solution space of
the problem represents the area in the first quadrant in which all the
constraints are satisfied simultaneously. In Figure 2.1, any point in or on the
boundary of the area ABCDEF is part
of the feasible solution space. All points outside this area are infeasible.
TORA
Moment.
The
menu-driven TORA
graphical LP module should prove helpful in reinforcing your understanding of
how the LP constraints are graphed. Select Linear Programming from the MAIN
menu. After inputting the model, select Solve => Graphical from the
SOLVE/MODIFY menu. In the output screen, you will be able to experiment
interactively with graphing the constraints one at a time, so you can see how
each constraint affects the solution space.
Step 2. Determination
of the Optimum Solution:
The
feasible space in Figure 2.1 is delineated by the line segments joining the
points A, B, C, D, E, and F. Any point
within or on the boundary of the space ABCDEFis feasible. Because the feasible
space ABCD EF consists of an infinite number of points, we need a
systematic procedure to identify the optimum solution.
The
determination of the optimum solution requires identifying the direction in
which the profit function z = 5x1 + 4x2
increases (recall that we are maximizing
z). We can
do so by assigning arbitrary
increasing values to z. For example,
using z = 10 and z = 15 would be equivalent to graphing the two lines 5X1 + 4X2 = 10 and 5x1
+ 4x2
= 15. Thus,
the direction of increase in z is as shown Figure 2.2. The optimum
solution occurs at C, which is
the point in the solution space beyond which any further increase will put z outside the boundaries of A BCDEF.
6x1 + 4x2 = 24
x1+ 2x2 = 6
The
solution is x1 = 3 and x2 = 1.5 with z = 5 X 3 + 4 X 1.5 = 21. 111is calls for a daily
product mix of 3 tons of exterior paint and 1.5 tons of interior paint. The
associated daily profit is $21,000.
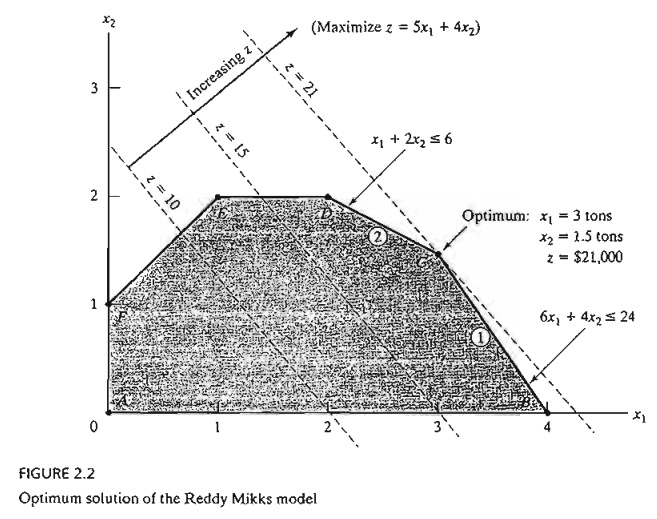
Optimum
solution of the Reddy Mikks model
An
important characteristic of the optimum LP solution is that it is always associated with a corner
point of the solution space (where two lines intersect). This is true even if
the objective function happens to be parallel to a constraint. For example, if
the objective function is z = 6x1 + 4x2, which is parallel to constraint 1, we can always
say that the optimum occurs at either corner point B or comer point C. Actually any point on the line
segment BC will be an alternative optimum (see also Example 3.5-2),
but the important observation here is that the line segment BC is totally defined by the corner points Band C.
TORA
Moment.
You can
use TORA interactively to see that the optimum is always associated with a
corner point. From the output screen, you can click View/Modiy Input Data to modify
the objective coefficients and resolve the problem graphically. You may use the
following objective functions to test the proposed idea:
(a) z = 5x1 + x2
(b) z =
5x1 + 4x2
(c) z = xl
+ 3x2
(d) z =
-xl + 2x2
(e) z = -
2x1 + x1
(f) z =
-x1 - x2
The
observation that the LP optimum is always associated with a corner point means
that the optimum solution can be found simply by enumerating all the corner
points as the following table shows:
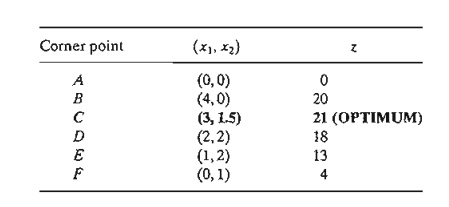
As the number
of constraints and variables increases, the number of corner points also increases,
and the proposed enumeration procedure becomes less tractable computationally.
Nevertheless, the idea shows that, from the standpoint of determining the LP
optimum, the solution space ABCDEF with its infinite number of solutions can, in fact, be replaced with a finite number of promising solution
points-namely, the corner points, A, B, C, D, E, and F. This result is key for the development of
the general algebraic algorithm, called the simplex
method, which we will study in
Chapter 3.
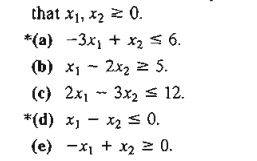
1. Determine the feasible space for each of the following independent constraints, given that
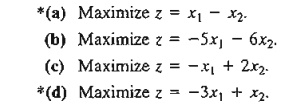
2. Identify the direction of increase in z in each of the following cases:
3. Determine the solution space and the optimum solution of the Reddy Mikks model for each of the following independent changes:
The maximum daily demand for exterior paint is at most 2.5 tons.
The daily demand for interior paint is at least 2 tons.
The daily demand for interior paint is exactly 1 ton higher than that for exterior paint.
The daily availability of raw material Ml is at least 24 tons.
The daily availability of raw material Ml is at least 24 tons, and the daily demand for interior paint exceeds that for exterior paint by at least 1 ton.
4. A company that operates 10 hours a day manufactures two products on three sequential processes. The following table summarizes the data of the problem:
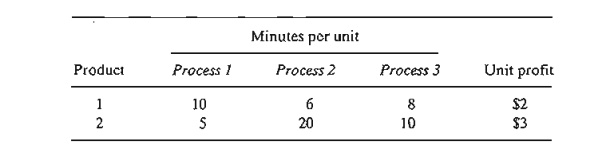
Determine the optimal mix of the two products.
5. A company produces two products, A and B. The sales volume for A is at least 80% of the total sales of both A and B. However, the company cannot sell more than 100 units of A per day. Both products use one raw material, of which the maximum daily availability is 240 lb. The usage rates of the raw material are 2 lb per unit of A and 4 lb per unit of B. The profit units for A and B are $20 and $50, respectively. Determine the optimal product mix for the company.
6. Alumco manufactures aluminum sheets and aluminum bars. The maximum production capacity is estimated at either 800 sheets or 600 bars per day. The maximum daily demand is 550 sheets and 580 bars. The profit per ton is $40 per sheet and $35 per bar. Determine the optimal daily production mix.
7. An individual wishes to invest $5000 over the next year in two types of investment: Investment A yields 5% and investment B yields 8%. Market research recommends an allocation of at least 25% in A and at most 50% in B. Moreover, investment in A should be at least half the investment in B. How should the fund be allocated to the two investments?
8. The Continuing Education Division at the Ozark Community College offers a total of 30 courses each semester. The courses offered are usually of two types: practical, such as woodworking, word processing, and car maintenance; and humanistic, such as histo-ry, music, and fine arts. To satisfy the demands of the community, at least 10 courses of each type must be offered each semester. The division estimates that the revenues of offering practical and humanistic courses are approximately $1500 and $1000 per course, respectively.
a. Devise an optimal course offering for the college.
b. Show that the worth per additional course is $1500, which is the same as the revenue per practical course. What does this result mean in terms of offering additional courses?
9. ChemLabs uses raw materials I and II to produce two domestic cleaning solutions, A and B. The daily availabilities of raw materials I and II are 150 and 145 units, respectively. One unit of solution A consumes .5 unit of raw material II and .6 unit of raw material II, and one unit of solution Buses .5 unit of raw material II and .4 unit of raw material II. The profits per unit of solutions A and Bare $8 and $10, respectively. The daily demand for solution A lies between 30 and 150 units, and that for solution B between 40 and 200 units. Find the optimal production amounts of A and B.
10. In the Ma-and-Pa grocery store, shelf space is limited and must be used effectively to in-crease profit. Two cereal items, Grano and Wheatie, compete for a total shelf space of 60 ft2. A box of Grano occupies.2 ft2 and a box of Wheatie needs .4 ft2. The maximum daily demands of Grano and Wheatie are 200 and 120 boxes, respectively. A box of qrano nets $1.00 in profit and a box of Wheatie $1.35. Ma-and-Pa thinks that because the unit profit ofWheatie is 35% higher than that of Grano, Wheatie should be allocated 35% more space than Grano, which amounts to allocating about 57% to Wheatie and 43% to Grano. What do you think?
11. Jack is an aspiring freshman at Diem University. He realizes that "all work and no play make Jack a dull boy." As a result, Jack wants to apportion his available time of about 10 hours a day between work and play. He estimates that play is twice as much fun as work. He also wants to study at least as much as he plays. However, Jack realizes that if he is going to get all his homework assignments done, he cannot play more than 4 hours a day. How should Jack allocate his time to maximize his pleasure from both work and play?
12. Wild West produces two types of cowboy hats. A type 1 hat requires twice as much labor time as a type 2. If the all available labor time is dedicated to Type 2 alone, the company can produce a total of 400 Type 2 hats a day. The respective market limits for the two types are 150 and 200 hats per day. The profit is $8 per Type 1 hat and $5 per Type 2 hat. Determine the number of hats of each type that would maximize profit.
13. Show & Sell can advertise its products on local radio and television (TV). The advertising budget is limited to $10,000 a month. Each minute of radio advertising costs $15 and each minute ofTY commercials $300. Show & Sell likes to advertise on radio at least twice as much as on TV. In the meantime, it is not practical to use more than 400 minutes of radio advertising a month. From past experience, advertising on TV is estimated to be 25 times as effective as on radio. Determine the optimum allocation of the budget to radio and TV advertising.
14. Wyoming Electric Coop owns a steam-turbine power-generating plant. Because Wyoming is rich in coal deposits, the plant generates its steam from coal. 111is, however, may result in emission that does not meet the Environmental Protection Agency standards. EPA regulations limit sulfur dioxide discharge to 2000 parts per million per ton of coal burned and smoke discharge from the plant stacks to 20 lb per hour. The Coop re-ceives two grades of pulverized coal, C1 and C2, for use in the steam plant. The two grades are usually mixed together before burning. For simplicity, it can be assumed that the amount of sulfur pollutant discharged (in parts per million) is a weighted average of the proportion of each grade used in the mixture. The following data are based on consumption of 1 ton per hour of each of the two coal grades.
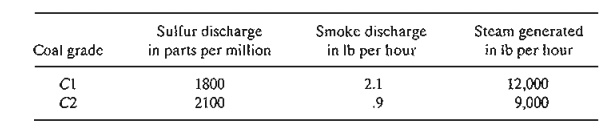
a. Determine the optimal ratio for mixing the two coal grades.
b. Determine the effect of relaxing the smoke discharge limit by 1 lb on the amount of generated steam per hour.
15. Top Toys is planning a new radio and TV advertising campaign. A radio commercial costs $300 and a TV ad cosls $2000. A total budget of $20,000 is allocated to the campaign. However, to ensure that each medium will have at least one radio commercial and one TV ad, the most that can be allocated to either medium cannot exceed 80% of the total budget. It is estimated that the first radio commercial will reach 5000 people, with each additional commercial reaching only 2000 new ones. For TV, the first ad will reach 4500 people and each additional ad an additional 3000. How should the budgeted amount be allocated between radio and TV?
16. The Burroughs Garment Company manufactures men's shirts and women's blouses for Walmark Discount Stores. Walmark will accept all the production supplied by Burroughs. The production process includes cutting, sewing, and packaging. Burroughs employs 25 workers in the cutting department, 35 in the sewing department, and 5 in the packaging department. The factory works one 8-hour shift, 5 days a week. The following table gives the time requirements and profits per unit for the two garments:
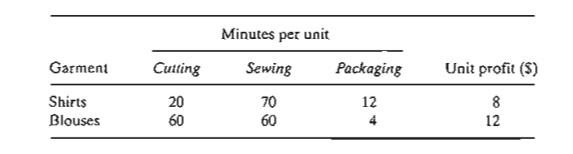
Determine the optimal weekly production schedule for Burroughs.
17. A furniture company manufactures desks and chairs. The sawing department cuts the lumber for both products, which is then sent to separate assembly departments. Assembled items are sent for finishing to the painting department. The daily capacity of the sawing department is 200 chairs or 80 desks. The chair assembly department can produce 120 chairs daily and the desk assembly department 60 desks daily. TIle paint department has a daily capacity of either 150 chairs or 110 desks. Given that the profit per chair is $50 and that of a desk is $100, determine the optimal production mix for the company.
18. An assembly line consisting of three consecutive stations produces two radio models: HiFi-1 and HiFi-2. The following table provides the assembly times for the three workstations.
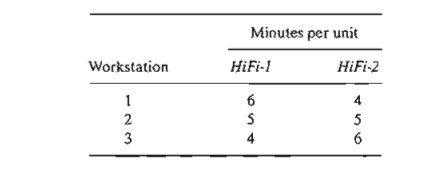
The daily maintenance for stations 1,2, and 3 consumes 10%,14%, and 12%, respectively, of the maximum 480 minutes available for each station each day. Determine the optimal product mix that will minimize the idle (or unused) times in the three workstations.
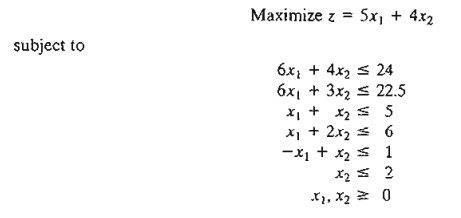
19. TORA Experiment. Enter the following LP into TORA and select the graphic solution mode to reveal the LP graphic screen.
Next, on a sheet of paper, graph and scale the x1 and x2 axes for the problem (you may also click Print Graph on the top of the right window to obtain a ready-to-use scaled sheet). Now, graph a constraint manually on the prepared sheet, then click it on the left window of the screen to check your answer. Repeat the same for each constraint and then terminate the procedure with a graph of the objective function. The suggested process is designed to test and reinforce your understanding of the graphical LP solution through immediate feedback from TORA.
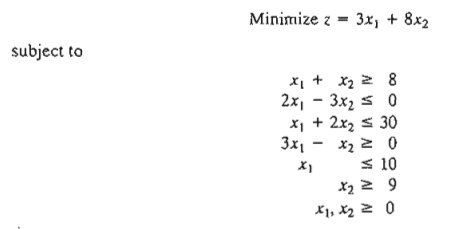
20. TORA Experiment. Consider the following LP model:
In LP, a constraint is said to be redundant if its removal from the model leaves the feasible solution space unchanged. Use the graphical facility of TORA to identify the redundant constraints, then show that their removal (simply by not graphing them) does not affect the solution space or the optimal solution.
21. TORA Experiment. In the Reddy Mikks model, use TORA to show that the removal of the raw material constraints (constraints 1 and 2) would result in an unbounded solution space. What can be said in this case about the optimal solution of the model?
22. TORA Experiment. In the Reddy Mikks model, suppose that the following constraint is added to the problem.
X2 >= 3
Use TORA to show that the resulting model has conflicting constraints that cannot be satisfied simultaneously and hence it has no feasible solution.
Related Topics