Chapter: Biochemistry: Electron Transport and Oxidative Phosphorylation
Reduction Potentials in the Electron Transport Chain
Reduction Potentials in the Electron
Transport Chain
Up until now, most of the energy considerations we have had
concerned phosphorylation potentials. We saw how the free-energy change
associated with hydrolysis of ATP could be used to drive otherwise endergonic
reactions. The opposite is also true—when a reaction is highly exergonic, it
can drive the formation of ATP. When we look closely at the energy changes in
electron transport, a more useful approach is to consider the change in energy
associated with the movement of electrons from one carrier to another. Each
carrier in the electron transport chain can be isolated and studied, and each
can exist in an oxidized or a reduced form. If we had two potential electron
carriers, such as NADH and
coenzyme Q, for example, how would we know whether electrons would be more
likely to be transferred from the NADH to the coenzyme Q or the other way
around? This is determined by measuring a reduction
potential for each of the carriers. A molecule with a high reduction
potential tends to be reduced if it is paired with a molecule with a lower
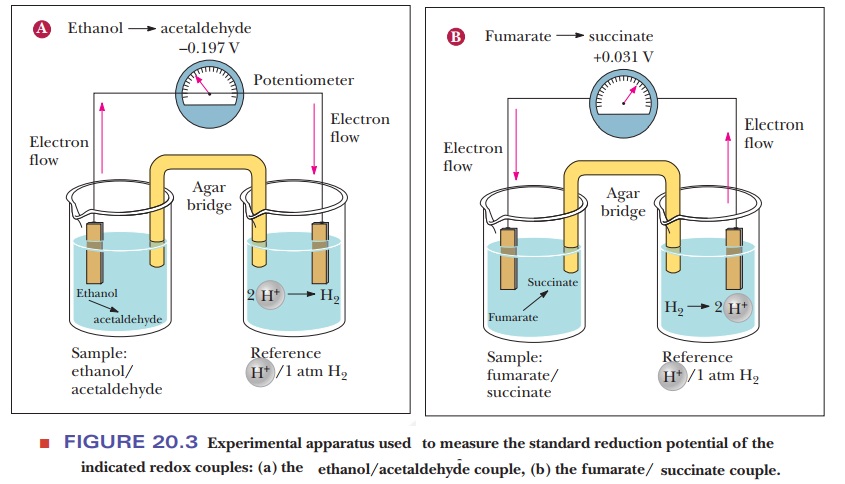
reduction potential. This is measured by making a simple battery cell, as shown
in Figure 20.3. The reference point is the half-cell on the right where
hydrogen ion is in aqueous solution in equilibrium with hydrogen gas. The reduction
of hydrogen ion to hydrogen gas
2H+
+ 2e– - > H2
is the
control and is considered to have a voltage (E) of zero. The sample to be tested is in the other half-cell. The
electric circuit is completed by bridge with a salt-containing agar gel.
How can reduction potentials be used to predict the direction of electron transport?
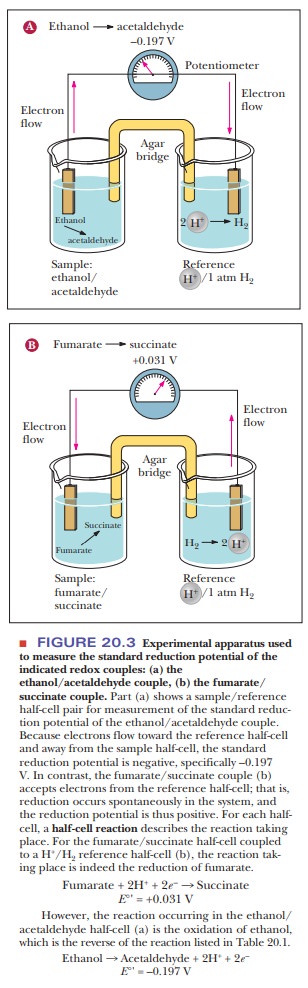
Figure
20.3a shows what happens if ethanol and acetaldehyde are put into the sample
half-cell. Electrons flow away from the sample cell and toward the reference
cell. This means that the hydrogen ion is being reduced to hydrogen gas and the
ethanol is being oxidized to acetaldehyde. Therefore, the hydrogen/ H+
pair has a higher reduction potential than the ethanol/acetaldehyde pair. If we
look at Figure 20.3b, we see the opposite. When fumarate and succinate are put
into the sample half-cell, the electrons flow in the opposite direction,
meaning that fumarate is being reduced to succinate while hydrogen gas is being
oxidized to H+. The direction of electron flow and the magnitude of
the observed voltage allow us to make a table, as shown in Table 20.1. Because
this is a table of standard reduction potentials, all the reactions are shown
as reductions. The value being measured is the standard biological voltage of
each half reaction E°'. This value is
calculated based on the compounds in the cells being at 1 M and the pH being 7 at the standard temperature of 25°C.
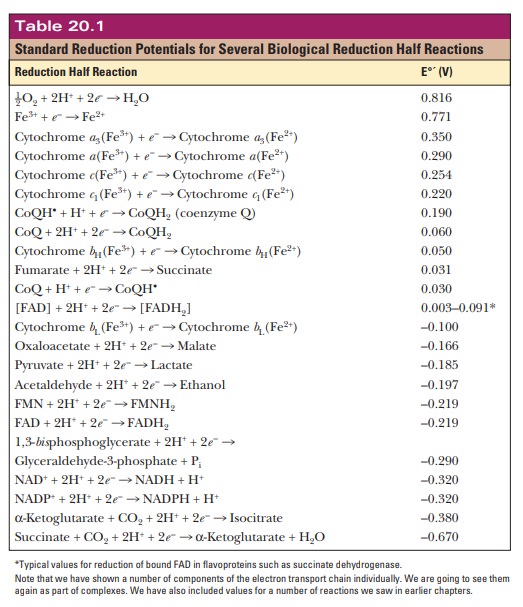
To
interpret the data in this table for the purpose of electron transport, we need
to look at the reduction potentials of the electron carriers involved. A
reaction at the top of the table tends to occur as written if it is paired with
a reaction that is lower down on the table. For example, we have already seen
that the final step of the electron transport chain is the reduction of oxygen
to water. This reaction is at the top of Table 20.1 with a reduction potential
of 0.816 V, a very positive number. If this reaction were paired directly with
NAD+/NADH, what would happen? The standard reduction potential for
NAD+ forming NADH is given near the bottom of the table. Its
reduction potential is –0.320 V.
NAD+
+ 2H+ + 2e– -
> NADH + H+E°' = –0.320
V
This
means that, if the two half reactions are paired during a redox reaction, the
one for the NADH must be reversed. NADH gives up its electrons so that oxygen
can be reduced to water:
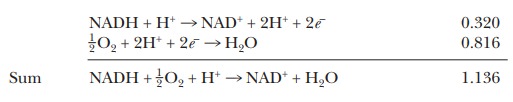
The
overall voltage for this reaction is the sum of the standard reduction potentials—in
this case, 0.816 V + 0.320 V, or 1.136 V. Note that we had to change the sign
on the standard reduction potential for the NADH because we had to reverse the
direction of its reaction.
The ∆G° of a redox reaction is calculated
using

wheren is the number moles of electrons
transferred, F is Faraday’s constant
(96.485 kJ V–1 mol–1), and ΔΕ°' is the total voltage for the two half reactions. As we can see
by this equation, ∆G° is negative
when ΔΕ°' is positive. Therefore, we can always
calculate the direction in which a redox reaction will go under standard
conditions by combining the two half reactions in the way that gives the
largest positive value for ΔΕ°'. For this example, ∆G° would be calculated as follows:
∆G° = –(2)(96.485 kJ V–1mol–1)(1.136 V) = –219 kJ mol–1
This
would be a very large number if NADH reduced oxygen directly. As we shall see
in the next section, NADH passes its electrons along a chain that eventually
leads to oxygen, but it does not reduce oxygen directly.
Before
moving on, it should be noted that, just as there is a difference between ∆G° and ∆G, there is a similar difference between E° and E. Recall that we devoted several sections to the
question of standard states, including the modified standard state for
biochemical reactions. The notations G
and E refer to the free-energy change
and the reduction poten-tial under any conditions, respectively. When all
components of a reaction are in their standard state (1 atm pressure, 25°C, all
solutes at 1 M concentration), we
write ∆G° and E°, respectively, for the standard free-energy change and standard
reduction potential. The modified standard state for biochemical reactions
takes note of the fact that having all solutes at 1 M concentration includes the hydrogen ion concentration. That
implies a pH equal to zero. Consequently, we define a modified standard state
for biochemistry that dif-fers from the usual one only in that pH = 7. Under
these conditions, we write ∆G°’ and E°' for the standard free-energy change
and the standard reductionpotential, respectively. The true direction of
electron flow in a redox reaction is also based on the true values of the
concentrations for the reactants and products, since the cellular
concentrations are never 1 M.
Summary
Standard reduction potentials provide a basis for comparison among
oxidation–reduction reactions.
The sequence of reactions in the electron transport chain can be
pre-dicted by using reduction potentials.
Related Topics