Libre Office Calc | Chapter 23 | 8th Science - Working with Charts | 8th Science : Chapter 23 : Libre Office Calc
Chapter: 8th Science : Chapter 23 : Libre Office Calc
Working with Charts
One of the most popular features of Libre Office Calc software is to generate charts based on numeric data.
Working with Charts
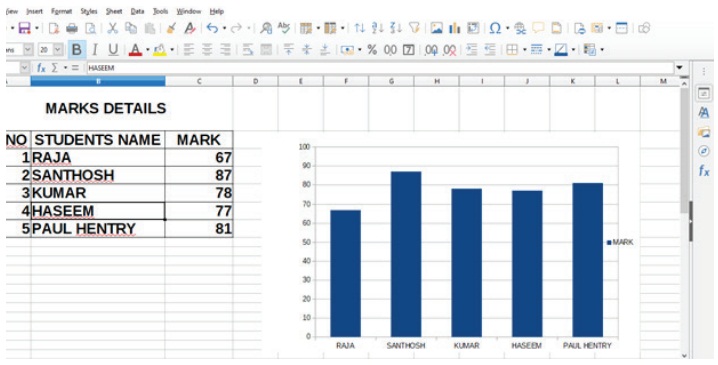
One of the most popular features of
Libre Office Calc software is to generate charts based on numeric data. The
purpose of chart is to visualize the data for easy understanding. To draw a
chart, follow the procedure given below:
* Select the data which you want to
chart.
* Click on Insert → Chart or click on the Insert Chart icon.
Tags : Libre Office Calc | Chapter 23 | 8th Science , 8th Science : Chapter 23 : Libre Office Calc
Study Material, Lecturing Notes, Assignment, Reference, Wiki description explanation, brief detail
8th Science : Chapter 23 : Libre Office Calc : Working with Charts | Libre Office Calc | Chapter 23 | 8th Science
Related Topics
8th Science : Chapter 23 : Libre Office Calc