Formula, Solved Example Problems - Various measures of central tendency | 11th Statistics : Chapter 5 : Measures of Central Tendency
Chapter: 11th Statistics : Chapter 5 : Measures of Central Tendency
Various measures of central tendency
Various
measures of central tendency
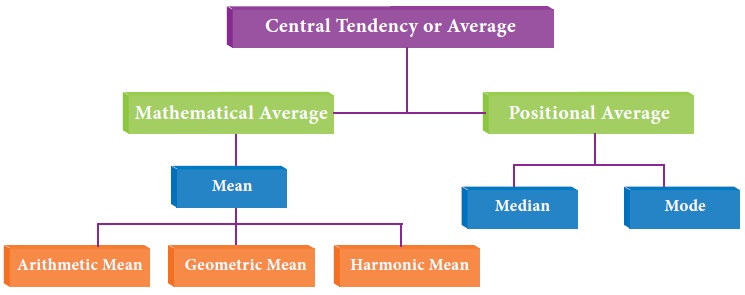
Arithmetic Mean
(a) To find A.M. for Raw data
For a raw data, the arithmetic mean of a series of numbers is
sum of all observations divided by the number of observations in the series.
Thus if x1, x2, ..., xn
represent the values of n
observations, then arithmetic mean (A.M.) for n observations is: (direct method)

There are two methods for computing the A.M :
(i) Direct method
(ii) Short cut method.
Example 5.1
The following data represent the number of books issued in a
school library on selected from 7 different days 7, 9, 12, 15, 5, 4, 11 find
the mean number of books.
Solution:
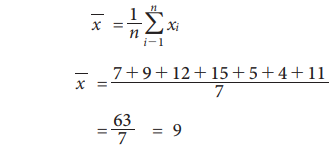
Hence
the mean of the number of books is 9
Short-cut Method to find A.M.
Under
this method an assumed mean or an arbitrary value (denoted by A) is used as the
basis of calculation of deviations (di) from individual values. That is
if di = xi – A
Then

Example 5.2
A
student’s marks in 5 subjects are 75, 68, 80, 92, 56. Find the average of his
marks.
Solution:
Let
us take the assumed mean, A = 68
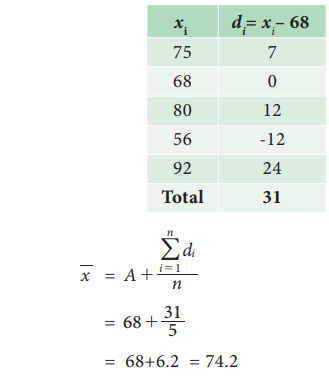
The
arithmetic mean of average marks is 74.2
(b) To
find A.M. for Discrete Grouped data
If
x1, x2, ..., xn are discrete values with the
corresponding frequencies f1, f2, …, fn. Then the mean for discrete
grouped data is defined as (direct method)

In the short cut method the formula is modified as

Example 5.3
A proof reads through 73 pages manuscript The number of mistakes
found on each of the pages are summarized in the table below Determine the mean
number of mistakes found per page

Solution:
(i) Direct Method
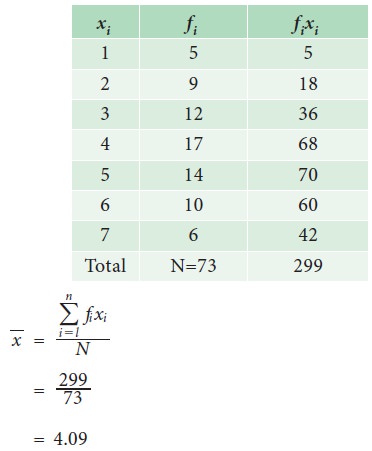
The mean number of mistakes is 4.09
(ii) Short-cut Method
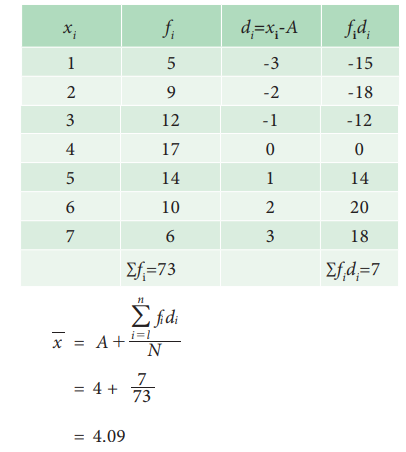
The
mean number of mistakes = 4.09
(c) Mean for Continuous Grouped data:
For
the computation of A.M for the continuous grouped data, we can use direct
method or short cut method.
Direct Method:
The
formula is

Short cut method
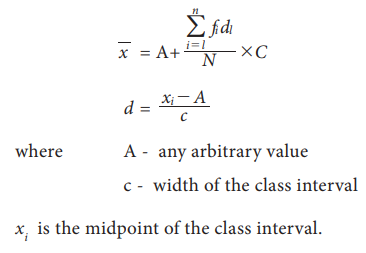
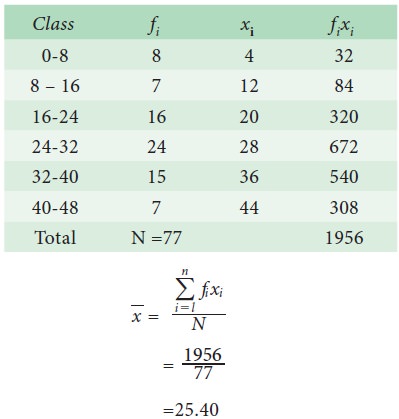
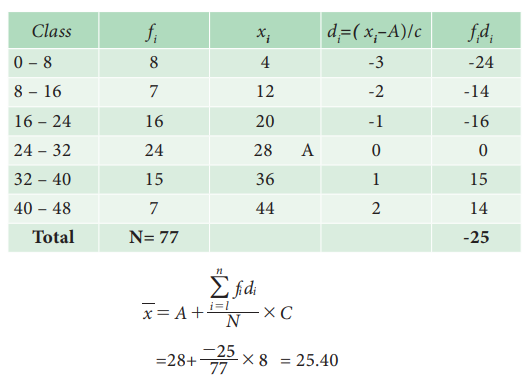
Example 5.4
The
following the distribution of persons according to different income groups

Find
the average income of the persons.
Solution :
Direct Method:
Short cut method:
Merits
· It is easy to compute and has a unique value.
· It is based on all the observations.
· It is well defined.
· It is least affected by sampling fluctuations.
·
It
can be used for further statistical analysis.
Limitations
· The mean is unduly affected by the extreme items (outliers).
· It cannot be determined for the qualitative data such as beauty, honesty etc.
·
It
cannot be located by observations on the graphic method.
When to use?
Arithmetic
mean is a best representative of the data if the data set is homogeneous. On
the other hand if the data set is heterogeneous the result may be misleading
and may not represent the data.
Weighted Arithmetic Mean
The
arithmetic mean, as discussed earlier, gives equal importance (or weights) to
each observation in the data set. However, there are situations in which values
of individual observations in the data set are not of equal importance. Under
these circumstances, we may attach, a weight, as an indicator of their
importance to each observation value.

Uses of weighted arithmetic mean
Weighted
arithmetic mean is used in:
·
The
construction of index numbers.
·
Comparison
of results of two or more groups where number of items in the groups differs.
·
Computation
of standardized death and birth rates.
Example 5.5
The
weights assigned to different components in an examination or Component
Weightage Marks scored
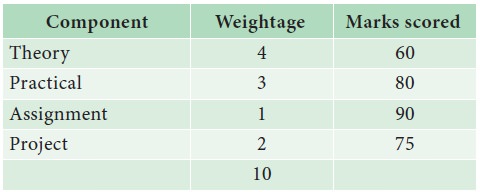
Calculate
the weighted average score of the student who scored marks as given in the
table
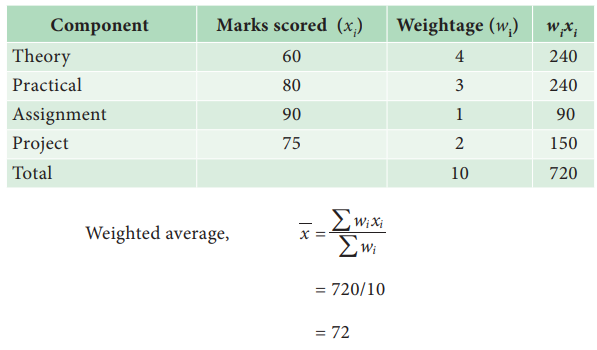
Solution:
Combined Mean:
Let ![]() 1 and
1 and ![]() 2 are the arithmetic
mean of two groups (having the same unit of measurement of a variable), based
on n1 and n2 observations respectively. Then the combined mean can be
calculated using
2 are the arithmetic
mean of two groups (having the same unit of measurement of a variable), based
on n1 and n2 observations respectively. Then the combined mean can be
calculated using

Remark : The above result can be extended
to any number of groups.
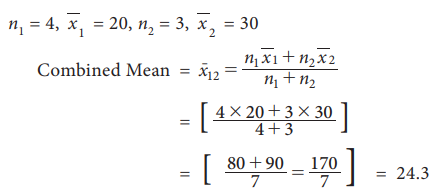
Example 5.6
A
class consists of 4 boys and 3 girls. The average marks obtained by the boys
and girls are 20 and 30 respectively. Find the class average.
Solution:
Geometric Mean(GM)
(a) G.M. For Ungrouped data
The
Geometric Mean (G.M.) of a set of n observations is the nth root of their
product. If x1, x2, ... , xn are n observations then

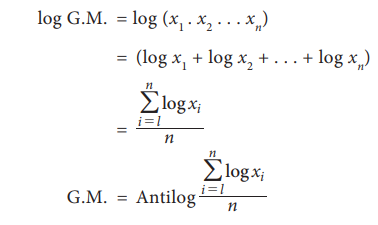
Taking
the nth root of a number is difficult. Thus, the computation is done as under
Example 5.7
Calculate the geometric mean of the annual percentage growth
rate of profits in business corporate from the year 2000 to 2005 is given below
50, 72, 54, 82, 93
Solution:
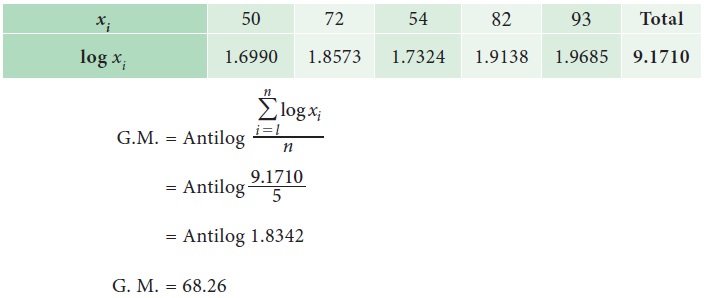
Geometrical mean of annual percentage growth rate of profits is
68.26
Example 5.8
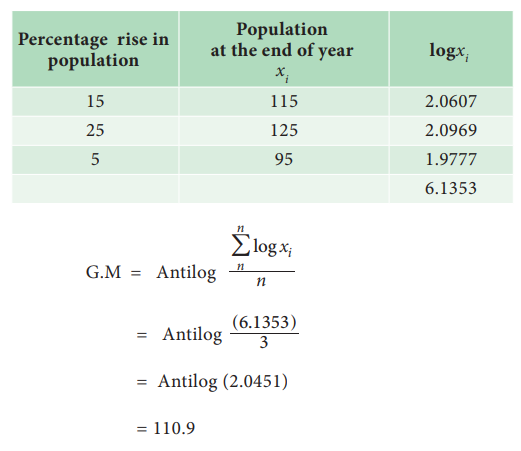
The population in a city increased at the rate of 15% and 25%
for two successive years. In the next year it decreased at the rate of 5%. Find
the average rate of growt
Solution:
Let us assume that the population is 100
(b) G.M. For Discrete grouped data
If x1, x2,……xn are discrete values of the variate x with corresponding
frequencies f1, f2, ... fn. Then geometric mean is defined as

Example 5.9
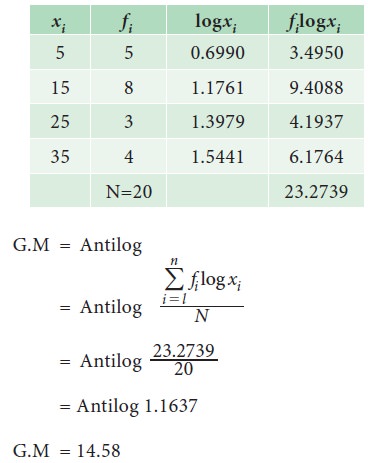
Find the G.M for the following data, which gives the defective
screws obtained in a factory.

Solution:
(c) G.M. for Continuous grouped data

Example 5.10
The following is the distribution of marks obtained by 109
students in a subject in an institution. Find the Geometric mean.

Solution:
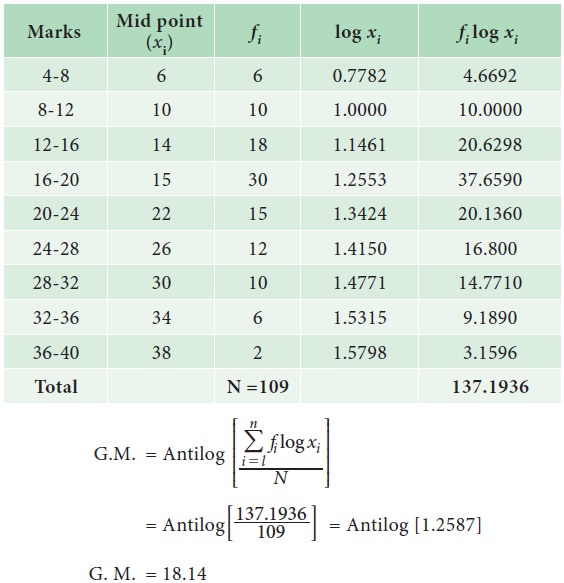
Geometric mean marks of 109 students in a subject is 18.14
Merits of Geometric Mean:
·
It is based on all the observations
·
It is rigidly defined
·
It is capable of further algebraic treatment
·
It is less affected by the extreme values
·
It is suitable for averaging ratios, percentages and rates.
Limitations of Geometric Mean:
·
It is difficult to understand
·
The geometric mean cannot be computed if any item in the series
is negative or zero.
·
The GM may not be the actual value of the series
·
It brings out the property of the ratio of the change and not
the absolute difference of change as the case in arithmetic mean.
Harmonic Mean (H.M.)
Harmonic Mean is defined as the reciprocal of the arithmetic
mean of reciprocals of the observations.
(a) H.M. for Ungrouped data
Let x1, x2, ..., xn be the n
observations then the harmonic mean is defined as

Example 5.11
A man travels from Jaipur to Agra by a car and takes 4 hours to
cover the whole distance. In the first hour he travels at a speed of 50 km/hr,
in the second hour his speed is 64 km/hr, in third hour his speed is 80 km/hr
and in the fourth hour he travels at the speed of 55 km/hr. Find the average
speed of the motorist.
Solution:
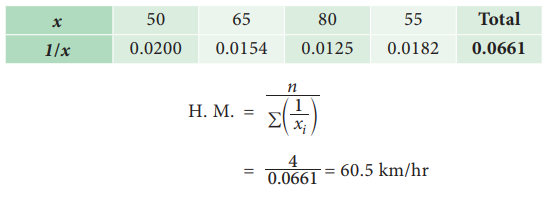
Average speed of the motorist is 60.5km/hr
(b) H.M. for Discrete Grouped data:
For a frequency distribution

Example 5.12
The following data is obtained from the survey. Compute H.M

Solution:
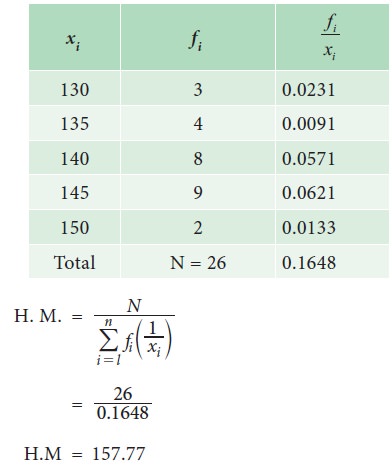
(c) H.M. for Continuous data:

Where xi is
the mid-point of the class interval
Example 5.13
Find the harmonic mean of the following distribution of data

Solution:
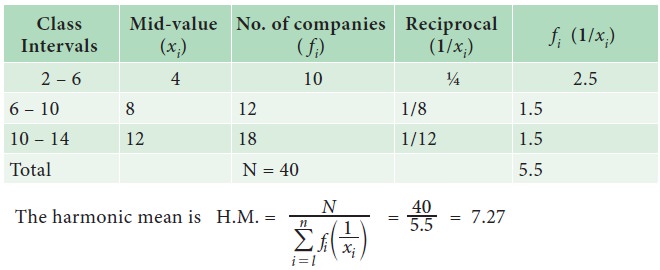
Merits of H.M:
·
It is rigidly defined
·
It is based on all the observations of the series
·
It is suitable in case of series having wide dispersion
·
It is suitable for further mathematical treatment
·
It gives less weight to large items and more weight to small
items
Limitations of H.M:
·
It is difficult to calculate and is not understandable
·
All the values must be available for computation
·
It is not popular due to its complex calculation.
·
It is usually a value which does not exist in series
When to use?
Harmonic mean is used
to calculate the average value when the values are expressed as value/unit. Since
the speed is expressed as km/hour, harmonic mean is used for the calculation of
average speed.
Relationship among the averages:
In any distribution when the original items are different the
A.M., G.M. and H.M would also differ and will be in the following order:
A.M. ≥ G.M ≥ H.M
Median
Median is the value of the variable which divides the whole set
of data into two equal parts. It is the value such that in a set of
observations, 50% observations are above and 50% observations are below it.
Hence the median is a positional average.
(a) Median for Ungrouped or Raw data:
In this case, the data is arranged in either ascending or
descending order of magnitude.
(i) If the number of
observations n is an odd number, then
the median is represented by the numerical value of x, corresponds to the positioning point of n+1 / 2 in ordered
observations. That is,
Median = value of (n+1 / 2)th observation in the data array
If the number of observations n is an even number, then the
median is defined as the arithmetic mean of the middle values in the array That
is,

Example 5.14
The number of rooms in the seven five stars hotel in Chennai
city is 71, 30, 61, 59, 31, 40 and 29. Find the median number of rooms
Solution:
Arrange the data in ascending order 29, 30, 31, 40, 59, 61, 71
n = 7 (odd)
Median = 7+1 / 2 = 4th positional value
Median = 40 rooms
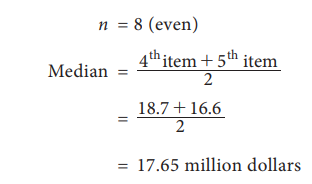
Example 5.15
The
export of agricultural product in million dollars from a country during eight
quarters in 1974 and 1975 was recorded as 29.7, 16.6, 2.3, 14.1, 36.6, 18.7,
3.5, 21.3
Find
the median of the given set of values
Solution:
We
arrange the data in descending order
36.6,
29.7, 21.3, 18.7, 16.6, 14.1, 3.5, 2.3
Cumulative Frequency
In
a grouped distribution, values are associated with frequencies. The cumulative
frequencies are calculated to know the total number of items above or below a
certain limit.This is obtained by adding the frequencies successively up to the
required level. This cumulative frequencies are useful to calculate median,
quartiles, deciles and percentiles.
(b) Median for Discrete grouped data
We
can find median using following steps
i.
Calculate the cumulative frequencies
ii.
Find (N+1)/2, where N=Σf=total
frequencies
iii.
Identify the cumulative frequency just greater than (N+1)/2
iv.
The value of x corresponding to that cumulative frequency is the (N+1)/2
median.
Example 5.16
The following data are the weights of students in a class. Find
the median weights of the students

Solution:
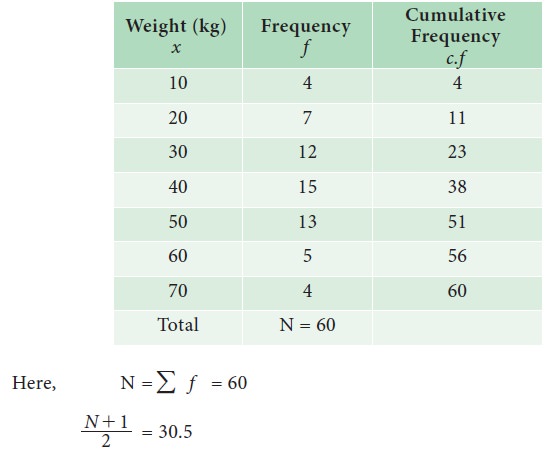
The cumulative frequency greater than 30.5 is 38.The value of x corresponding to 38 is 40. The median
weight of the students is 40 kgs
(c) Median for Continuous grouped data
In this case, the data is given in the form of a frequency table
with class-interval etc., The following formula is used to calculate the
median.

Where
l = Lower limit of the
median class
N = Total Numbers of
frequencies
f = Frequency of the
median class
m = Cumulative frequency of
the class preceding the median class
c = the class interval of
the median class.
From the formula, it is clear that one has to find the median
class first. Median class is, that class which correspond to the cumulative
frequency just greater than N/2.
Example 5.17
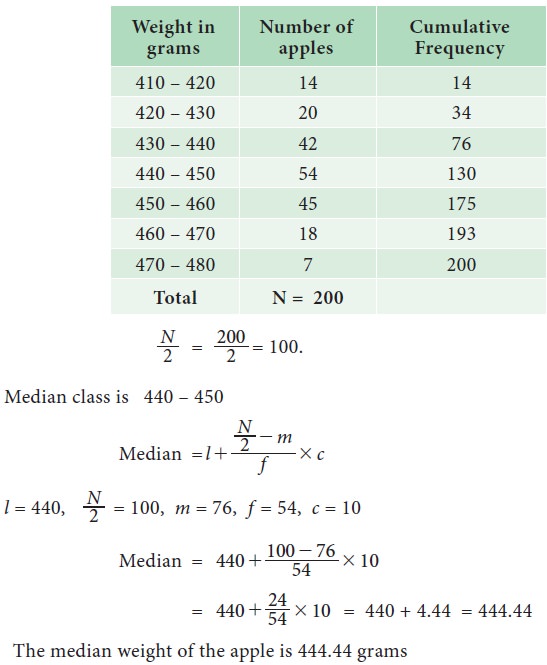
The following data attained from a garden records of certain
period Calculate the median weight of the apple

Solution:
Example 5.18
The following table shows age distribution of persons in a
particular region:
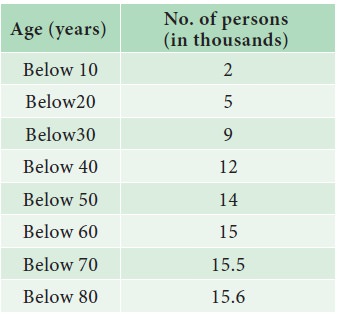
Find the median age.
Solution:
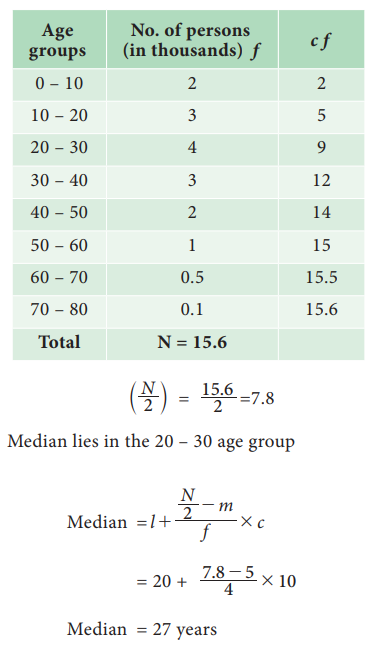
We are given upper limit and less than cumulative frequencies.
First find the class-intervals and the frequencies. Since the values are
increasing by 10, hence the width of the class interval is equal to 10.
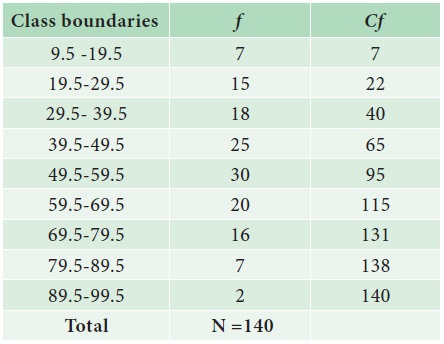
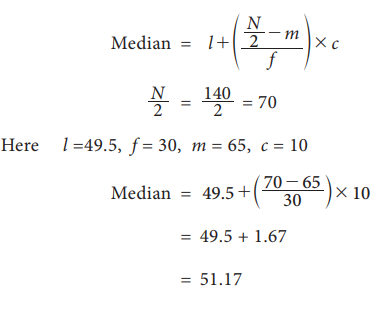
Example 5.19
The following is the marks obtained by 140 students in a
college. Find the median marks

Solution:
Graphical method for Location of median
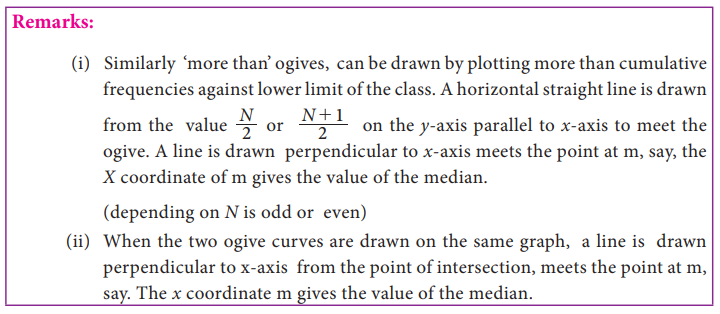
Median can be located with the help of the cumulative frequency
curve or ‘ogive’.
The procedure for locating median in a grouped data is as
follows:
Step 1 : The
class intervals, are represented on the horizontal axis (x-axis)
Step 2 : The
cumulative frequency corresponding to different classes is calculated. These
cumulative frequencies are plotted on the vertical axis (y-axis) against the
upper limit of the respective class interval
Step 3 : The curve obtained by
joining the points by means of freehand is called the ‘less than ogive’.
Step 4 : A horizontal straight
line is drawn from the value N/2 and N+1 / 2on the y-axis parallel to x-
axis to meet the ogive. (depending on N is
odd or even)
Step 5 : From
the point of intersection, draw a line, perpendicular to the horizontal axis
which meet the x axis at m say.
Step 6 : The
value m at x axis gives the value of
the median.
Example 5.20
Draw ogive curves for the following frequency distribution and
determine the median.
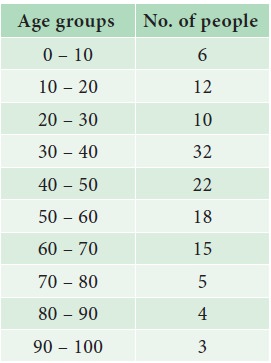
Solution:
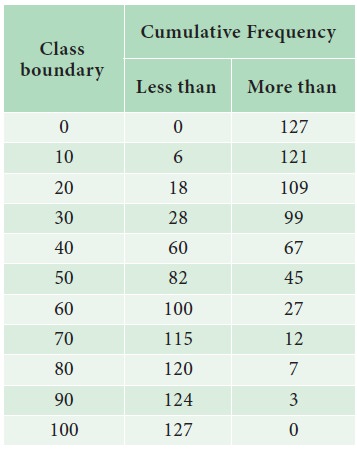
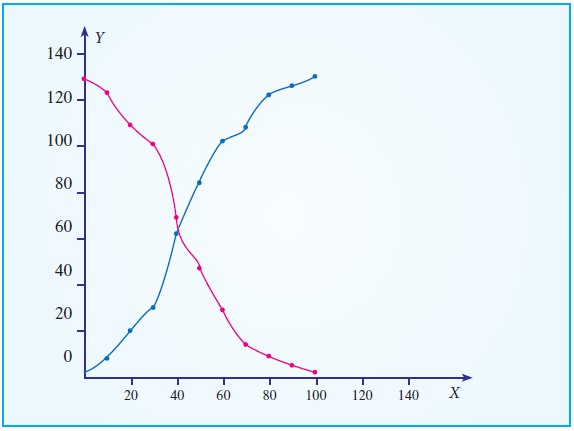
The median value from the graph is 42
Merits
·
It is easy to compute. It can be calculated by mere inspection
and by the graphical method
·
It is not affected by extreme values.
·
It can be easily located even if the class intervals in the
series are unequal
Limitations
·
It is not amenable to further algebraic treatment
·
It is a positional average and is based on the middle item
·
It does not take into account the actual values of the items in
the series
Mode
According to Croxton and Cowden, ‘The mode of a distribution is the value at the
point around which the items tend to be most heavily concentrated.
In a busy road, where we take a survey on the vehicle - traffic
on the road at a place at a particular period of time, we observe the number of
two wheelers is more than cars, buses and other vehicles. Because of the higher
frequency, we say that the modal value of this survey is ‘two wheelers’
Mode is defined as the
value which occurs most frequently in a data set. The mode obtained may be two or more in frequency distribution.

Computation of mode:
(a) For Ungrouped or Raw Data:
The mode is defined as the value which occurs frequently in a
data set
Example 5.21
The following are the marks scored by 20 students in the class.
Find the mode 90, 70, 50, 30, 40, 86, 65, 73, 68, 90, 90, 10, 73, 25, 35, 88,
67, 80, 74, 46
Solution:
Since the marks 90 occurs the maximum number of times, three
times compared with the other numbers, mode is 90.
Example 5.22
A doctor who checked 9 patients’ sugar level is given below.
Find the mode value of the sugar levels. 80, 112, 110, 115, 124, 130, 100, 90,
150, 180
Solution:
Since each values occurs only once, there is no mode.
Example 5.23
Compute mode value for the following observations.
2, 7, 10, 12, 10, 19, 2, 11, 3, 12
Solution:
Here, the observations 10 and 12 occurs twice in the data set,
the modes are 10 and 12.
For discrete frequency distribution, mode is the value of the
variable corresponding to the maximum frequency.
Example 5.24
Calculate the mode from the following data

Solution:
Here, 7 is the maximum frequency, hence the value of x
corresponding to 7 is 8.
Therefore 8 is the mode.
(b) Mode for Continuous data:
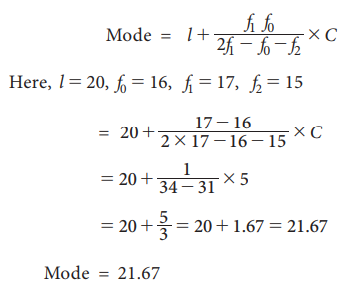
The mode or modal value of the distribution is that value of the
variate for which the frequency is maximum. It is the value around which the
items or observations tend to be most heavily concentrated. The mode is
computed by the formula.

Modal class is the class which has maximum frequency.
f1 = frequency of the modal class
f0 = frequency of the
class preceding the modal class
f2 = frequency of the class succeeding the modal class
c = width of the class
limits

Example 5.25
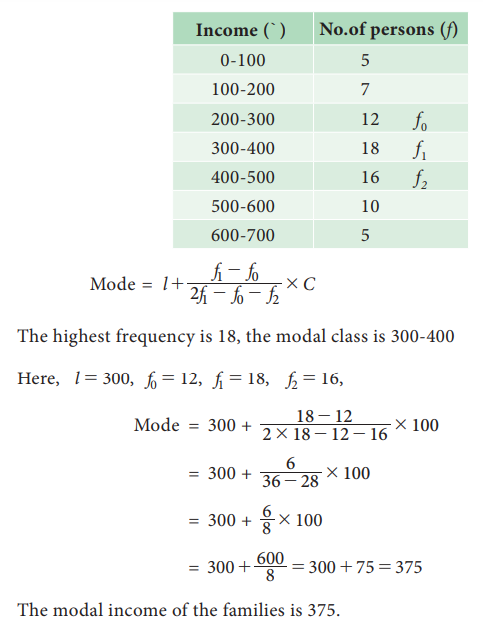
The following data relates to the daily income of families in an
urban area. Find the modal income of the families.

Solution:
Determination of Modal class:
For
a frequency distribution modal class corresponds to the class with maximum
frequency. But in any one of the following cases that is not easily possible.
i.
If the maximum frequency is repeated.
ii.
If the maximum frequency occurs in the beginning or at the end of the
distribution
iii.
If there are irregularities in the distribution, the modal class is determined
by the method of grouping.
Steps for preparing Analysis
table:
We prepare a grouping table with 6 columns
i.
In column I, we write down the given frequencies.
ii.
Column II is obtained by combining the frequencies two by two.
iii.
Leave the Ist frequency and combine the remaining frequencies
two by two and write in column III
iv.
Column IV is obtained by combining the frequencies three by
three.
v.
Leave the Ist frequency and combine the remaining frequencies
three by three and write in column V
vi.
Leave the Ist and 2nd frequencies and combine the remaining
frequencies three by three and write in column VI
Mark the highest frequency in each column. Then form an analysis
table to find the modal class. After finding the modal class use the formula to
calculate the modal value.
Example 5.26
Calculate mode for the following frequency distribution:

Solution:
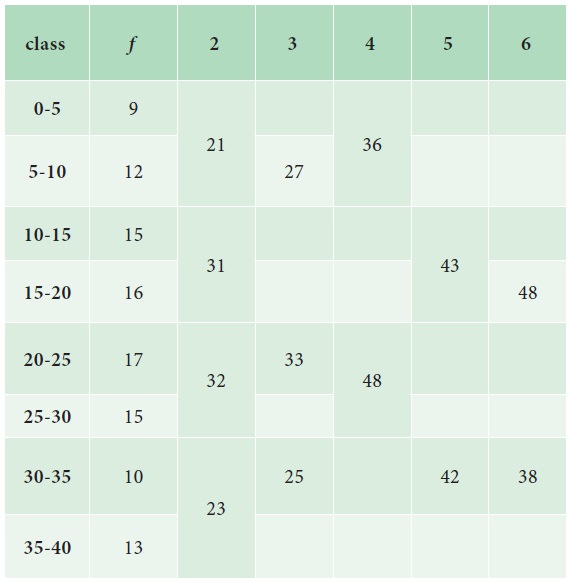
Analysis Table:
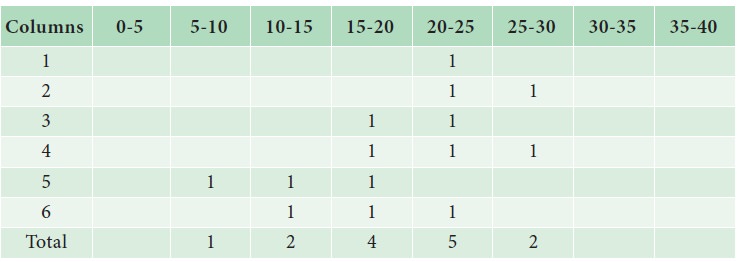
The maximum occurred corresponding to 20-25, and hence it is the modal class.
(d) Graphical Location of Mode
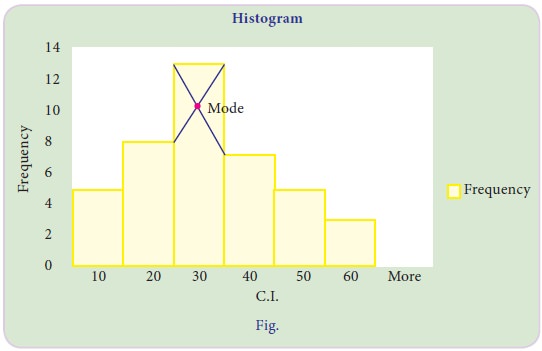
The following are the steps to locate mode by graph
i.
Draw
a histogram of the given distribution.
ii.
Join
the rectangle corner of the highest rectangle (modal class rectangle) by a
straight line to the top right corner of the preceding rectangle. Similarly the
top left corner of the highest rectangle is joined to the top left corner of
the rectangle on the right.
iii.
From
the point of intersection of these two diagonal lines, draw a perpendicular
line to the x –axis which meets at M.
iv.
The
value of x coordinate of M is the mode.
Example 5.27
Locate
the modal value graphically for the following frequency distribution

Solution:
Merits of Mode:
·
It
is comparatively easy to understand.
·
It
can be found graphically.
·
It
is easy to locate in some cases by inspection.
·
It
is not affected by extreme values.
·
It
is the simplest descriptive measure of average.
Demerits of Mode:
·
It
is not suitable for further mathematical treatment.
·
It
is an unstable measure as it is affected more by sampling fluctuations.
·
Mode
for the series with unequal class intervals cannot be calculated.
·
In
a bimodal distribution, there are two modal classes and it is difficult to
determine the values of the mode.
Related Topics