Formula, Solved Example Problems - Median | 11th Statistics : Chapter 5 : Measures of Central Tendency
Chapter: 11th Statistics : Chapter 5 : Measures of Central Tendency
Median
Median
Median is the value of the variable which divides the whole set of data into two equal parts. It is the value such that in a set of observations, 50% observations are above and 50% observations are below it. Hence the median is a positional average.
(a) Median for Ungrouped or Raw data:
In this case, the data is arranged in either ascending or descending order of magnitude.
(i) If the number of observations n is an odd number, then the median is represented by the numerical value of x, corresponds to the positioning point of n+1 / 2 in ordered observations. That is,
Median = value of (n+1 / 2)th observation in the data array
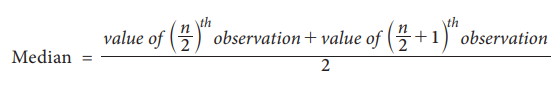
If the number of observations n is an even number, then the median is defined as the arithmetic mean of the middle values in the array That is,
Example 5.14
The number of rooms in the seven five stars hotel in Chennai city is 71, 30, 61, 59, 31, 40 and 29. Find the median number of rooms
Solution:
Arrange the data in ascending order 29, 30, 31, 40, 59, 61, 71
n = 7 (odd)
Median = 7+1 / 2 = 4th positional value
Median = 40 rooms
Example 5.15
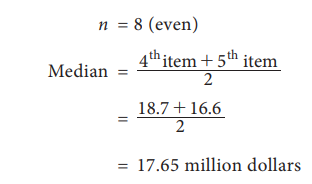
The export of agricultural product in million dollars from a country during eight quarters in 1974 and 1975 was recorded as 29.7, 16.6, 2.3, 14.1, 36.6, 18.7, 3.5, 21.3
Find the median of the given set of values
Solution:
We arrange the data in descending order
36.6, 29.7, 21.3, 18.7, 16.6, 14.1, 3.5, 2.3
Cumulative Frequency
In a grouped distribution, values are associated with frequencies. The cumulative frequencies are calculated to know the total number of items above or below a certain limit.This is obtained by adding the frequencies successively up to the required level. This cumulative frequencies are useful to calculate median, quartiles, deciles and percentiles.
(b) Median for Discrete grouped data
We can find median using following steps
i. Calculate the cumulative frequencies
ii. Find (N+1)/2, where N=Σf=total frequencies
iii. Identify the cumulative frequency just greater than (N+1)/2
iv. The value of x corresponding to that cumulative frequency is the (N+1)/2 median.
Example 5.16
The following data are the weights of students in a class. Find the median weights of the students
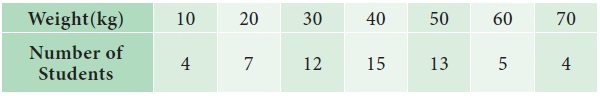
Solution:
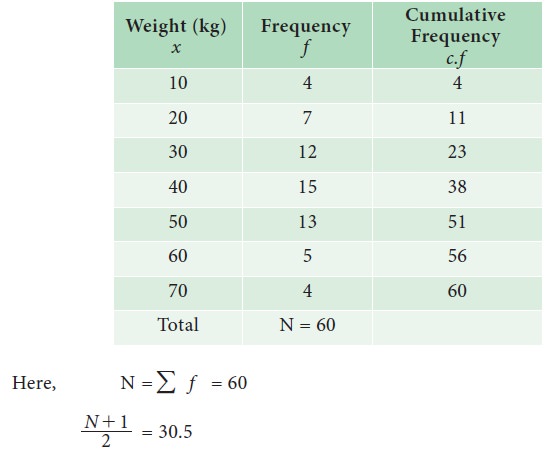
The cumulative frequency greater than 30.5 is 38.The value of x corresponding to 38 is 40. The median weight of the students is 40 kgs
(c) Median for Continuous grouped data
In this case, the data is given in the form of a frequency table with class-interval etc., The following formula is used to calculate the median.
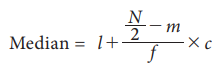
Where
l = Lower limit of the median class
N = Total Numbers of frequencies
f = Frequency of the median class
m = Cumulative frequency of the class preceding the median class
c = the class interval of the median class.
From the formula, it is clear that one has to find the median class first. Median class is, that class which correspond to the cumulative frequency just greater than N/2.
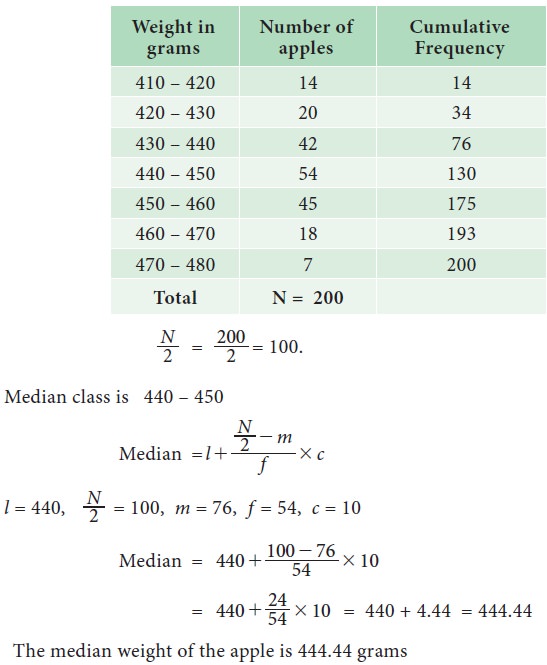
Example 5.17
The following data attained from a garden records of certain period Calculate the median weight of the apple
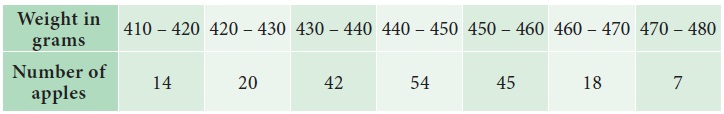
Solution:
Example 5.18
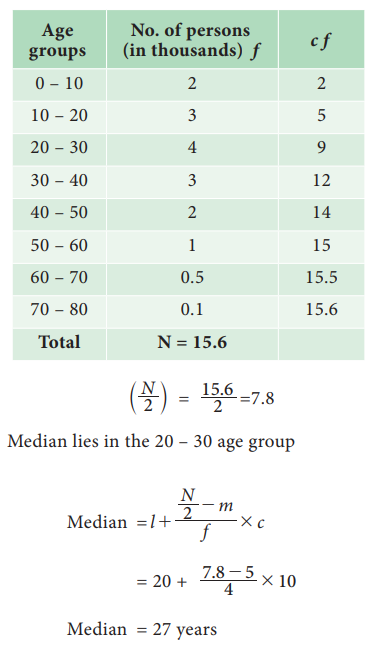
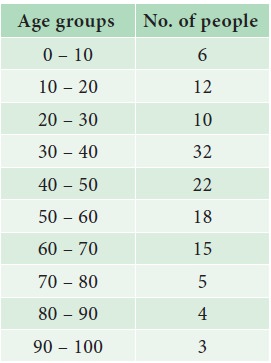
The following table shows age distribution of persons in a particular region:
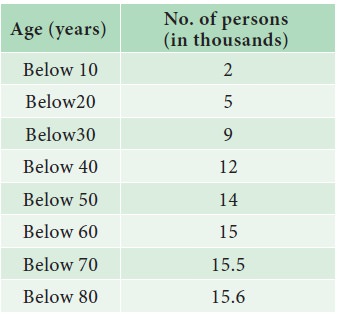
Find the median age.
Solution:
We are given upper limit and less than cumulative frequencies. First find the class-intervals and the frequencies. Since the values are increasing by 10, hence the width of the class interval is equal to 10.
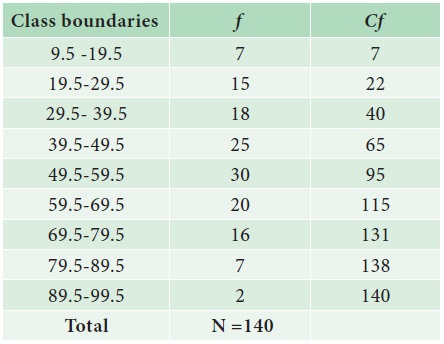
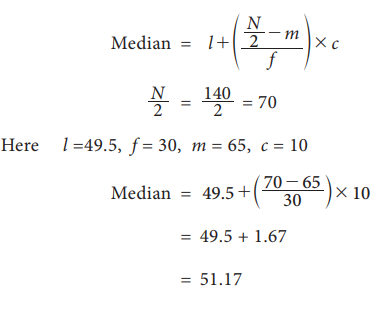
Example 5.19
The following is the marks obtained by 140 students in a college. Find the median marks

Solution:
Graphical method for Location of median
Median can be located with the help of the cumulative frequency curve or ‘ogive’.
The procedure for locating median in a grouped data is as follows:
Step 1 : The class intervals, are represented on the horizontal axis (x-axis)
Step 2 : The cumulative frequency corresponding to different classes is calculated. These cumulative frequencies are plotted on the vertical axis (y-axis) against the upper limit of the respective class interval
Step 3 : The curve obtained by joining the points by means of freehand is called the ‘less than ogive’.
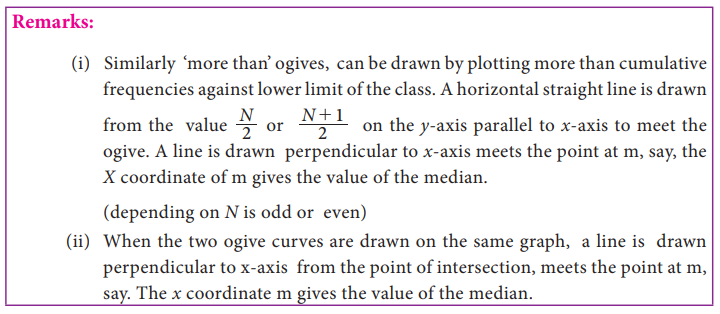
Step 4 : A horizontal straight line is drawn from the value N/2 and N+1 / 2on the y-axis parallel to x- axis to meet the ogive. (depending on N is odd or even)
Step 5 : From the point of intersection, draw a line, perpendicular to the horizontal axis which meet the x axis at m say.
Step 6 : The value m at x axis gives the value of the median.
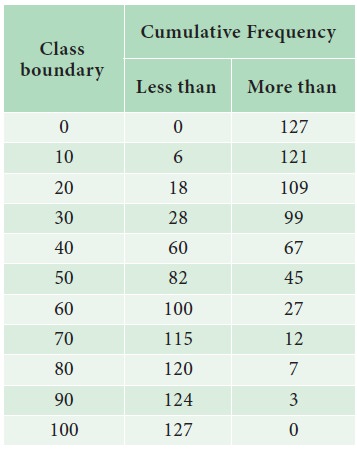
Example 5.20
Draw ogive curves for the following frequency distribution and determine the median.
Solution:
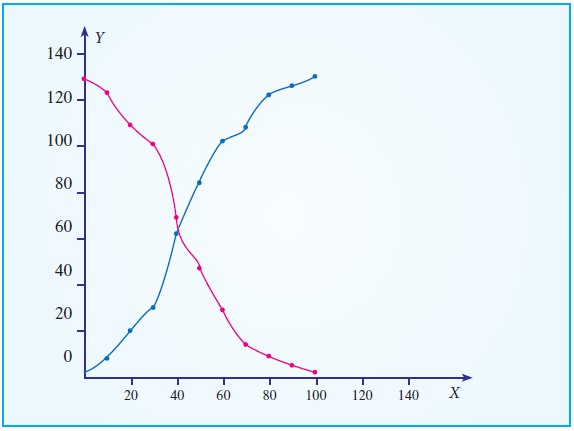
The median value from the graph is 42
Merits
· It is easy to compute. It can be calculated by mere inspection and by the graphical method
· It is not affected by extreme values.
· It can be easily located even if the class intervals in the series are unequal
Limitations
· It is not amenable to further algebraic treatment
· It is a positional average and is based on the middle item
· It does not take into account the actual values of the items in the series
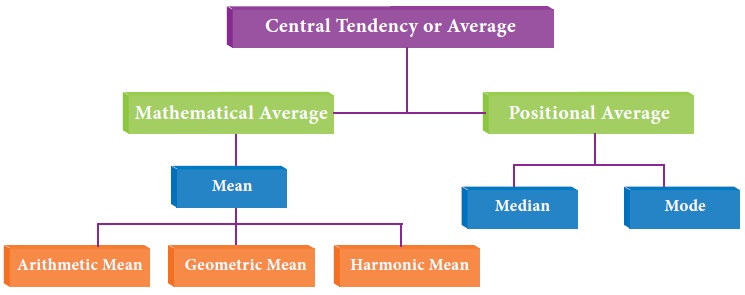
Various measures of central tendency
Related Topics