Questions with Answers, Solution | Statistics | Chapter 6 | 8th Maths - Try these, Recap Exercise, Student Activities, Think and answer | 8th Maths : Chapter 6 : Statistics
Chapter: 8th Maths : Chapter 6 : Statistics
Try these, Recap Exercise, Student Activities, Think and answer
Try these
1. Arrange the given data in ascending and descending order: 9,34,4,13,42,10,25,7,31,4,40
Solution:
Ascending order : 4, 4, 7, 9, 10, 13, 25, 31, 34, 40, 42.
Descending order : 42, 40, 34, 31, 25, 13, 10, 9, 7, 4, 4
2. Find the range of the given data : 53, 42, 61, 9, 39, 63, 14, 20, 06, 26, 31, 4, 57
Solution:
Ascending order, of the given data :
4, 6, 9, 14, 20, 26, 31,39, 42, 53, 57, 61, 63
Here largest value = 63
Smallest value = 4
∴ Range = Largest value − smallest value
= 63 − 4 = 59
Activity
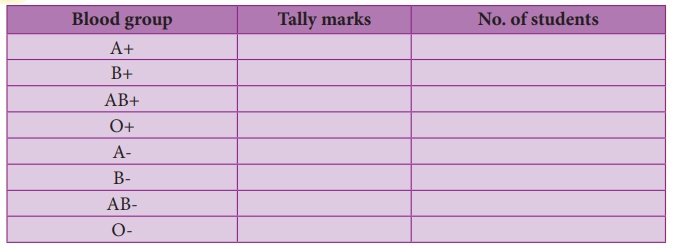
1. Collect the blood group of your classmates. Complete the table and analyse.
2. Observe the last alphabet in the name of your classmates, tabulate them and answer the following questions.
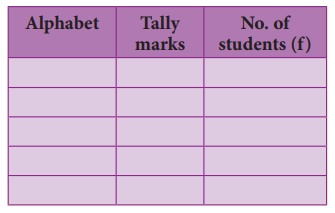
(i) In which letter do the names end the most?
(ii) In which letter do the names end the least?
(iii) What are the letters in which the names do not end with?
(iv) Girl names mostly end with ______ letter(s).
(v) Boy names mostly end with ______ letter(s).
Try these
1. Prepare a frequency table for the data : 3,4,2,4,5,6,1,3,2,1,5,3,6,2,1,3,2,4
Solution:
Ascending order of the given data.
1, 1, 1, 2, 2, 2, 2, 3, 3, 3, 3, 4, 4, 4, 5, 5, 6, 6
The distribution table :
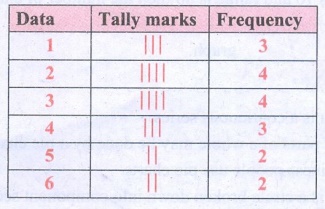
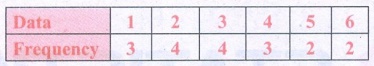
∴ Frequency Table :
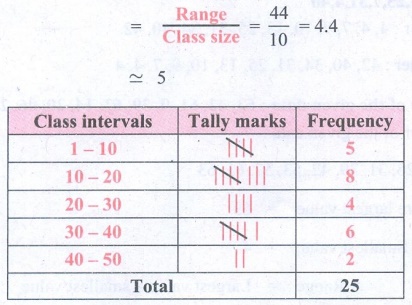
2. Prepare a grouped frequency table for the data : 10, 9, 3, 29, 17, 34, 23, 20, 39, 42, 5, 12, 19, 47, 18, 19, 27, 7, 13, 40, 38, 24, 34, 15, 40
Solution:
Largest value = 47
Smallest value = 3
Range = Largest value − Smallest value
= 47 − 3 = 44
Suppose we take class size as 10, then Number of class intervals possible
= Range / Class size = 44 / 10 = 4.4 ≃ 5
Note
Range: The difference between the largest and the smallest values of the data given. If 5, 15, 10, 7, 20, 18 are the data then, Range = 20–5=15
Note
Uses of pie chart:
1. Pie charts are widely used by the business and the media people.
2. With the help of Pie charts, one can show how the expenditure of the Government or Industry is distributed over different heads.
3. Research people use these type of charts to show their results.
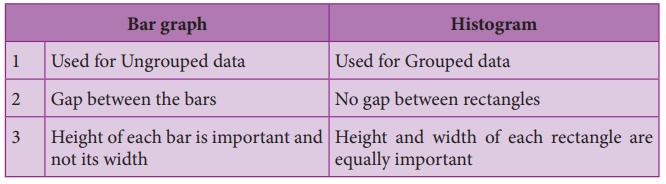
Note
Differences between a Bar graph and a Histogram
Note
If class intervals do not start from ‘0’ then, it is indicated by drawing a kink (Zig-Zag) mark (![]() ) on the x-axis near the origin. If necessary, the kink mark (
) on the x-axis near the origin. If necessary, the kink mark (![]() ) may be made on y-axis or on both the axes. i.e it indicates that we do not have data starting from the origin (O)
) may be made on y-axis or on both the axes. i.e it indicates that we do not have data starting from the origin (O)
Note
Sometimes imagined class intervals do not exist. For example, in case of marks obtained by the students in a test, we cannot go below zero and beyond maximum marks on the two sides. In such cases, the extreme line segments meet at the mid points of the vertical left and right sides of first and last rectangles respectively.
Related Topics