Questions with Answers, Solution | Statistics | Chapter 6 | 8th Maths - Exercise 6.3 | 8th Maths : Chapter 6 : Statistics
Chapter: 8th Maths : Chapter 6 : Statistics
Exercise 6.3
Exercise
6.3
Miscellaneous
Practice Problems
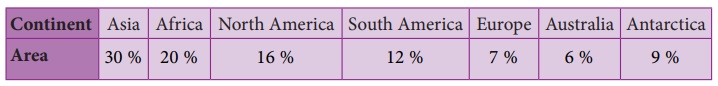
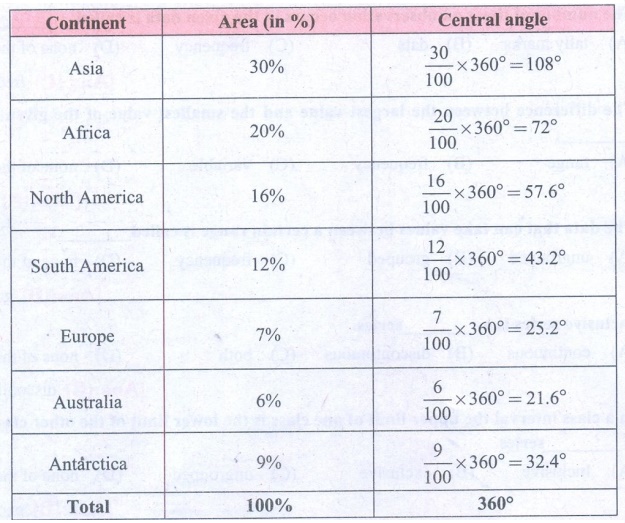
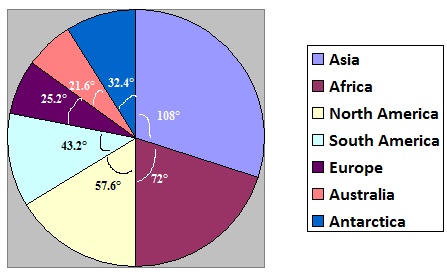
1. Draw a pie chart for the given table.
Solution:
Converting the area in percentage into components parts of 360°, we have.
Continental Area.
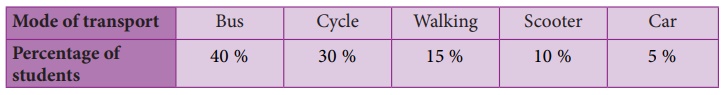
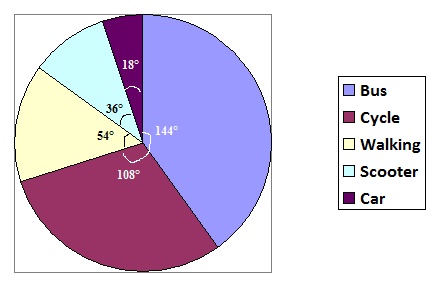
2. The data on modes of transport used by the students to come to school are given below. Draw a pie chart for the data.
Solution:
Converting the percentage into components parts of 360°, we have
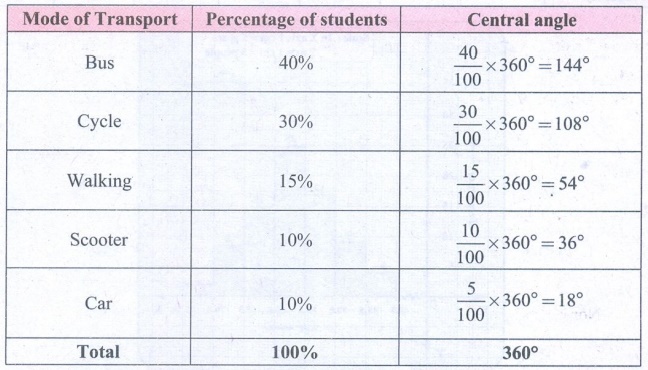
Mode of Transport by students.
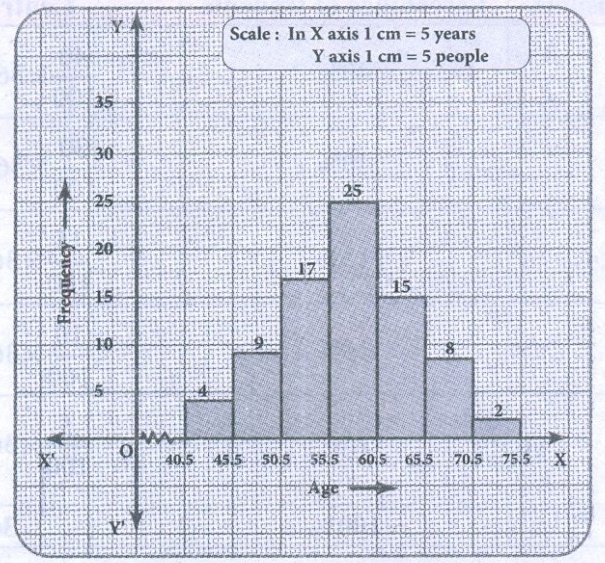
3. Draw a histogram for the given frequency
distribution.

Solution:
The given distribution is discontinuous.
Lower boundary = lower limit – 1/2 (gap between the adjacent
class interval)
= 41− 1/2 (l) = 40.5
Upper boundary = Upper limit + 1/2 (gap between the adjacent
class interval)
= 45 + 1/2(1) = 45.5
Now continuous frequency table is as below

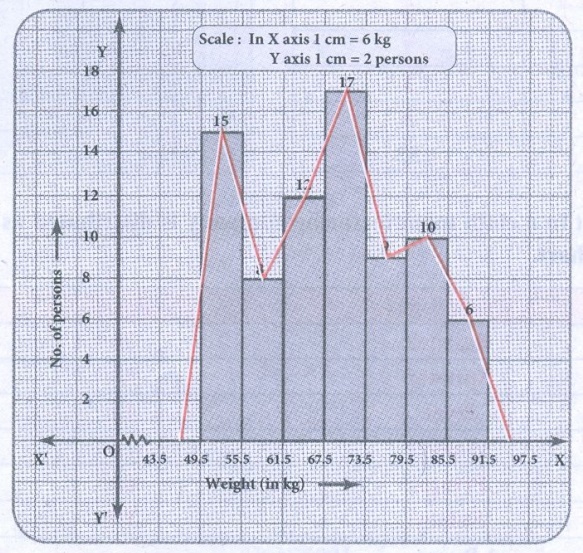
4. Draw a histogram and the frequency polygon in
the same diagram to represent the following data.

Solution:
The given distribution is discontinuous.
Lower boundary = lower limit – 1/2 (gap between the adjacent
class interval)
= 50 – 1/2(1) = 49.5
Upper boundary = Upper limit + 1/2 (gap between the adjacent
class interval)
= 55 + 1/2(1) = 55.5
∴ The continuous frequency
table is as below.

Challenging
problems
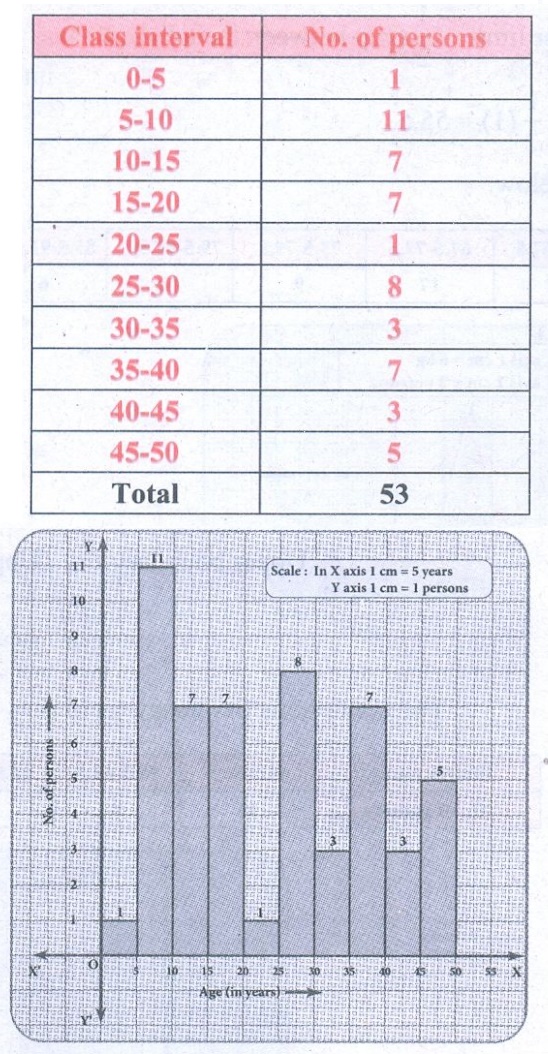
5. Form a continuous frequency distribution
table and draw histogram from the following data.
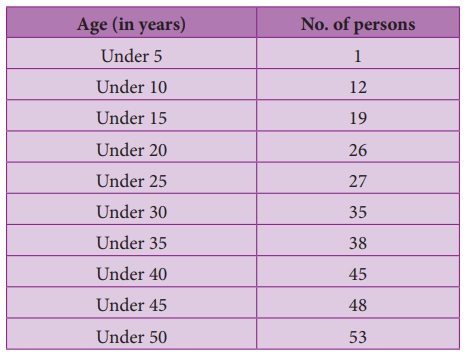
Solution:
Converting into continuous distribution we have
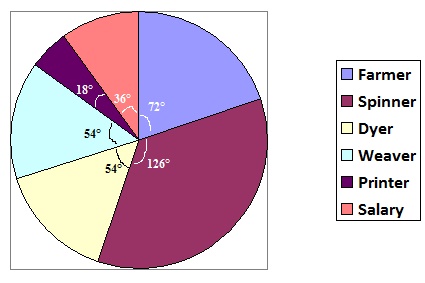
6. A rupee spent in a cloth manufacturing
company is distributed as follows. Represent this in a pie chart.
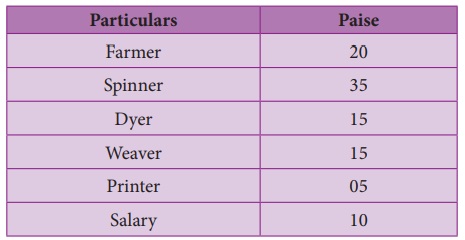
Solution:
1 Rupee = 100 paise.
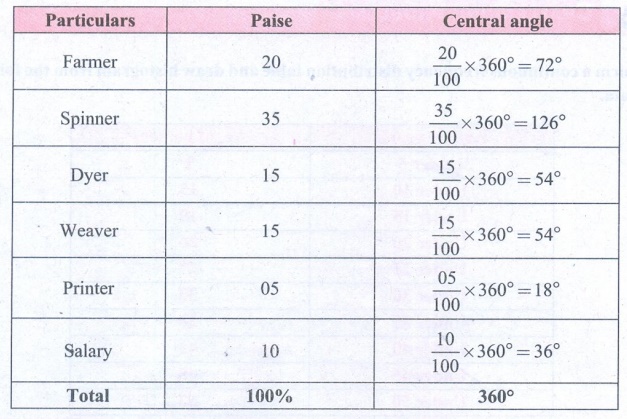
Expenditure of a cloth manufacturing company.
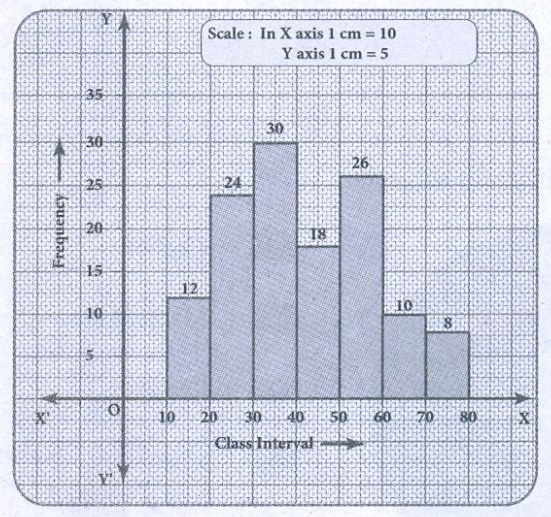
7. Draw a histogram for the following
data.

Solution:
Since mid values are given, the given distributors is
discontinuous.
Lower boundary = lower limit – 1/2 (gap between the adjacent
class interval)
= 15 – 1/2(10) = 10
Upper boundary = Upper limit + 1/2(gap between the adjacent
class interval)
= 15 + 1/2(10) = 20
The continuous distribution will be as follows.

Related Topics