Chapter 6 | 8th Maths - Statistics | 8th Maths : Chapter 6 : Statistics
Chapter: 8th Maths : Chapter 6 : Statistics
Statistics
Chapter
6
STATISTICS
Learning Objectives
• To recall
the formation of frequency tables.
• To construct
simple Pie-charts for the given data.
• To know
how to draw Histogram and Frequency Polygon for grouped data.
Introduction
Before we
learn on Pie charts, Histograms and Frequency Polygons, let us recall what we have
studied in the previous classes like data (primary and secondary) and frequency
tables for ungrouped data.
Kamaraj! Go and collect II-term Math marks of
all the students from our class.
Geetha! You go and note down the heights of all
the students from the cumulative record.
Students,
here the marks collected by Kamaraj and heights noted by Geetha are called ‘Data’.
Data is a
collection of facts such as numbers, words, measurements and observations.
For example:
Staff’s age in a company 27, 51, 19, 21, 46, 35, 52, 25, 57, 29.
1. Data:
Primary data:
These are
the data that are collected in person for the first time for a specific purpose.
Here, Kamaraj has collected the data of math marks from the students in person.
It is called primary data.
Also,
(i) Census in a village
(ii) Collection
of colours which the students like in a class are some examples of primary data.
Secondary data:
These are
the data that are sourced from some places that has originally collected it. This
kind of data has already been collected by some other persons. The statistical operation
may have been performed on them already. Here, Geetha also collected the data but
she took it from a record which had already collected them. This is called secondary
data.
Also, (i)
The details of 'PATTA' for a land can be had from the registration office.
(ii) Birth–Death
details data can be got from concern office are some examples of secondary data.
From these
primary and secondary data , Sometimes we can’t get any specific or required information
directly like, how many students have got more than 50 marks? how many students
got marks between 30 and 40? how many of them are with height 125 cm? If we need answer for these questions,
we have to tabulate the data.
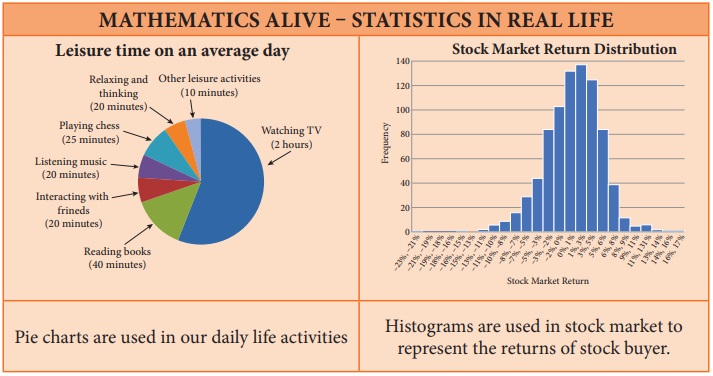
MATHEMATICS ALIVE STATISTICS IN REAL LIFE
Related Topics